
DFVisualizationSettings component#
Hint
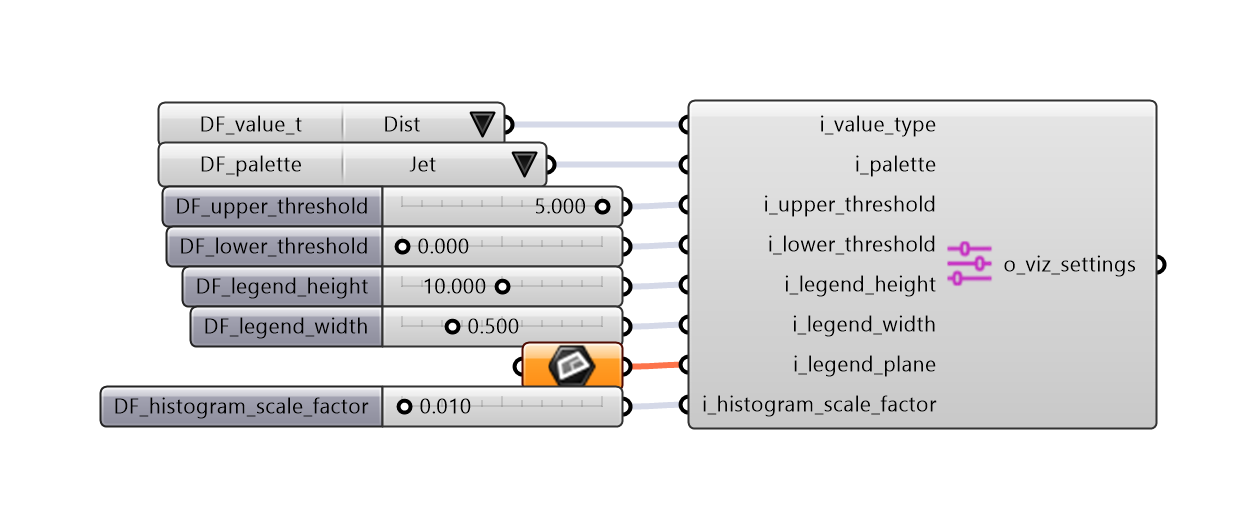
This component is automatically adding to the canvas all the input parameters for the component.
Inputs:
|
Which values to display. |
|
Select a color palette to map the values to |
|
Thresholds the values with a maximum value |
|
Thresholds the values with a minimum value |
|
Set the total height of the legend |
|
Set the total width of the legend |
|
A construction plane for the legend |
|
Scales the height of the histogram with a factor |
|
make one curve per item |
Outputs:
o_viz_settings |
Settings to be passed to the Visualization component |
Code:
#! python3

import Rhino
from ghpythonlib.componentbase import executingcomponent as component
from Grasshopper.Kernel import GH_RuntimeMessageLevel as RML

from diffCheck import df_visualization
from diffCheck import df_gh_canvas_utils


class DFVisualizationSettings(component):
    def __init__(self):
        self.poss_value_types = ["Dist", "MEAN", "RMSE", "MAX", "MIN", "STD"]
        self.poss_palettes = ["Jet", "Rainbow", "RdPu", "Viridis"]

        ghenv.Component.ExpireSolution(True)  # noqa: F821
        ghenv.Component.Attributes.PerformLayout()  # noqa: F821
        params = getattr(ghenv.Component.Params, "Input")  # noqa: F821

        for j in range(len(params)):
            Y_cord = params[j].Attributes.InputGrip.Y
            X_cord = params[j].Attributes.Pivot.X
            input_indx = j
            if "i_value_type" == params[j].NickName:
                df_gh_canvas_utils.add_str_valuelist(
                    ghenv.Component,  # noqa: F821
                    self.poss_value_types,
                    "DF_value_t",
                    input_indx, X_cord, Y_cord)
            if "i_palette" == params[j].NickName:
                df_gh_canvas_utils.add_str_valuelist(
                    ghenv.Component,  # noqa: F821
                    self.poss_palettes,
                    "DF_palette",
                    input_indx, X_cord, Y_cord)
            if "i_legend_height" == params[j].NickName:
                df_gh_canvas_utils.add_slider(
                    ghenv.Component,  # noqa: F821
                    "DF_legend_height",
                    input_indx,
                    0.000, 20.000, 10.000,
                    X_cord, Y_cord)
            if "i_legend_width" == params[j].NickName:
                df_gh_canvas_utils.add_slider(
                    ghenv.Component,  # noqa: F821
                    "DF_legend_width",
                    input_indx,
                    0.000, 2.000, 0.500,
                    X_cord, Y_cord)
            if "i_legend_plane" == params[j].NickName:
                df_gh_canvas_utils.add_plane_object(
                    ghenv.Component,  # noqa: F821
                    "DF_legend_plane",
                    input_indx, X_cord, Y_cord)
            if "i_histogram_scale_factor" == params[j].NickName:
                df_gh_canvas_utils.add_slider(
                    ghenv.Component,  # noqa: F821
                    "DF_histogram_scale_factor",
                    input_indx,
                    0.000, 1.000, 0.01,
                    X_cord, Y_cord)

    def RunScript(self,
        i_value_type: str,
        i_palette: str,
        i_upper_threshold: float,
        i_lower_threshold: float,
        i_legend_height: float,
        i_legend_width: float,
        i_legend_plane: Rhino.Geometry.Plane,
        i_histogram_scale_factor: float,
        i_one_histogram_per_item: bool):

        """
        Compiles all the visualization settings to feed to the visualization component

        :param i_value_type: selected type indicates Which values to display. Possible values: "dist", "RMSE", "MAX", "MIN", "STD"
        :param i_palette: Select a color palette to map the values to. Possible values: "Jet", "Rainbow", "RdPu", "Viridis"
        :param i_upper_threshold: Thresholds the values with a maximum value
        :param i_lower_threshold: Thresholds the values with a minimum value
        :param i_legend_height: the total height of the legend
        :param i_legend_width: the total width of the legend
        :param i_legend_plane: the construction plane of the legend
        :param i_histogram_scale_factor: Scales the height of the histogram with a factor

        :returns o_viz_settings: the results of the comparison all in one object
        """
        # set default values
        if i_value_type is not None:
            if i_value_type not in self.poss_value_types:
                ghenv.Component.AddRuntimeMessage(RML.Warning, "Possible values for i_value_type are: dist, MEAN, RMSE, MAX, MIN, STD")  # noqa: F821
                return None
        else:
            i_value_type = "Dist"
        if i_palette is not None:
            if i_palette not in self.poss_palettes:
                ghenv.Component.AddRuntimeMessage(RML.Warning, "Possible values for i_palette are: Jet, Rainbow, RdPu, Viridis")  # noqa: F821
                return None
        else:
            i_palette = "Jet"
        if i_legend_height is None:
            i_legend_height = 10
        if i_legend_width is None:
            i_legend_width = 0.5
        if i_legend_plane is None:
            i_legend_plane = Rhino.Geometry.Plane.WorldXY
        if i_histogram_scale_factor is None:
            i_histogram_scale_factor = 0.01
        if i_one_histogram_per_item is None:
            i_one_histogram_per_item = False

        # pack settings
        o_viz_settings = df_visualization.DFVizSettings(i_value_type,
                                                        i_palette,
                                                        i_upper_threshold,
                                                        i_lower_threshold,
                                                        i_legend_height,
                                                        i_legend_width,
                                                        i_legend_plane,
                                                        i_histogram_scale_factor,
                                                        i_one_histogram_per_item)

        return o_viz_settings