Joints evaluation#
Objective#
The following tutorial will guide you through the evaluation of joints in timber construction with DF. As a studycase we fabricated 3 beams presenting the same joints with:
a chainsaw, by hand
a circular saw, by hand
a CNC Maka machine
the goal being to evaluate the quality of the joints and the accuracy of the fabrication processes. In DF the evaluation of the joint is dual:
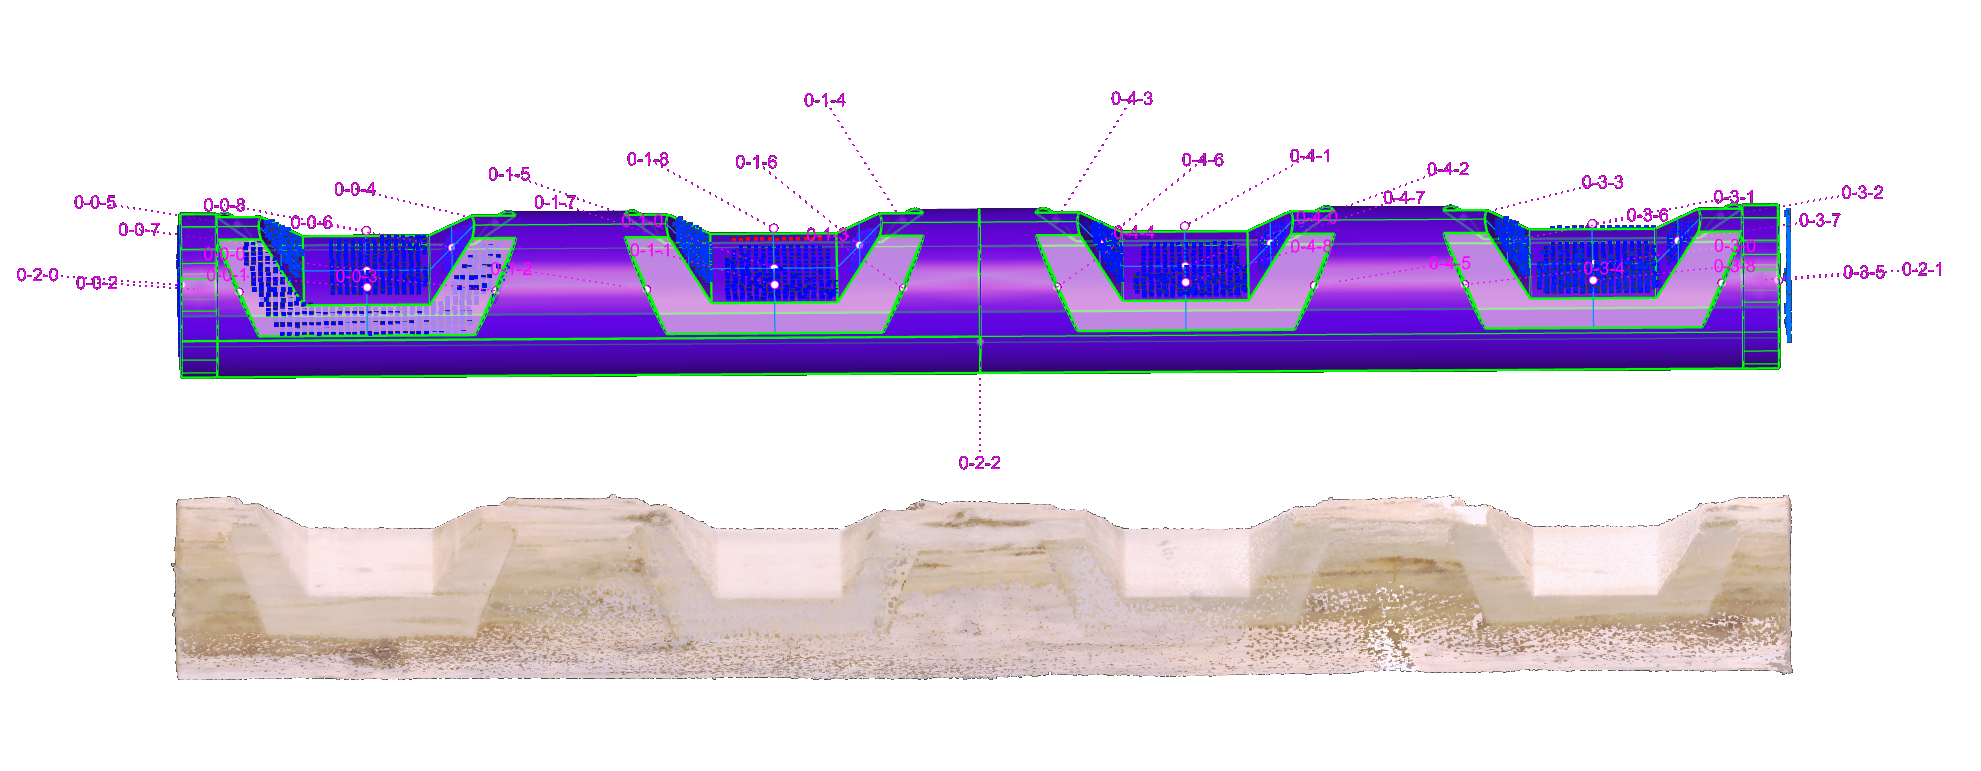
i) the evaluation of the joint itself: by comparing the CAD model of the joint with the scan of the joint informs us about the quality of the positioning of the joints on the beam.
ii) the evaluation of the joint’s faces: by comparing the CAD model of the joint’s faces with the scan of the joint informs us about the quality of the fabrication of the joint itself.
In the following we will see how to quantify and obtain data for these two metrics.
Download .gh file
Steps#
1. Input the data#
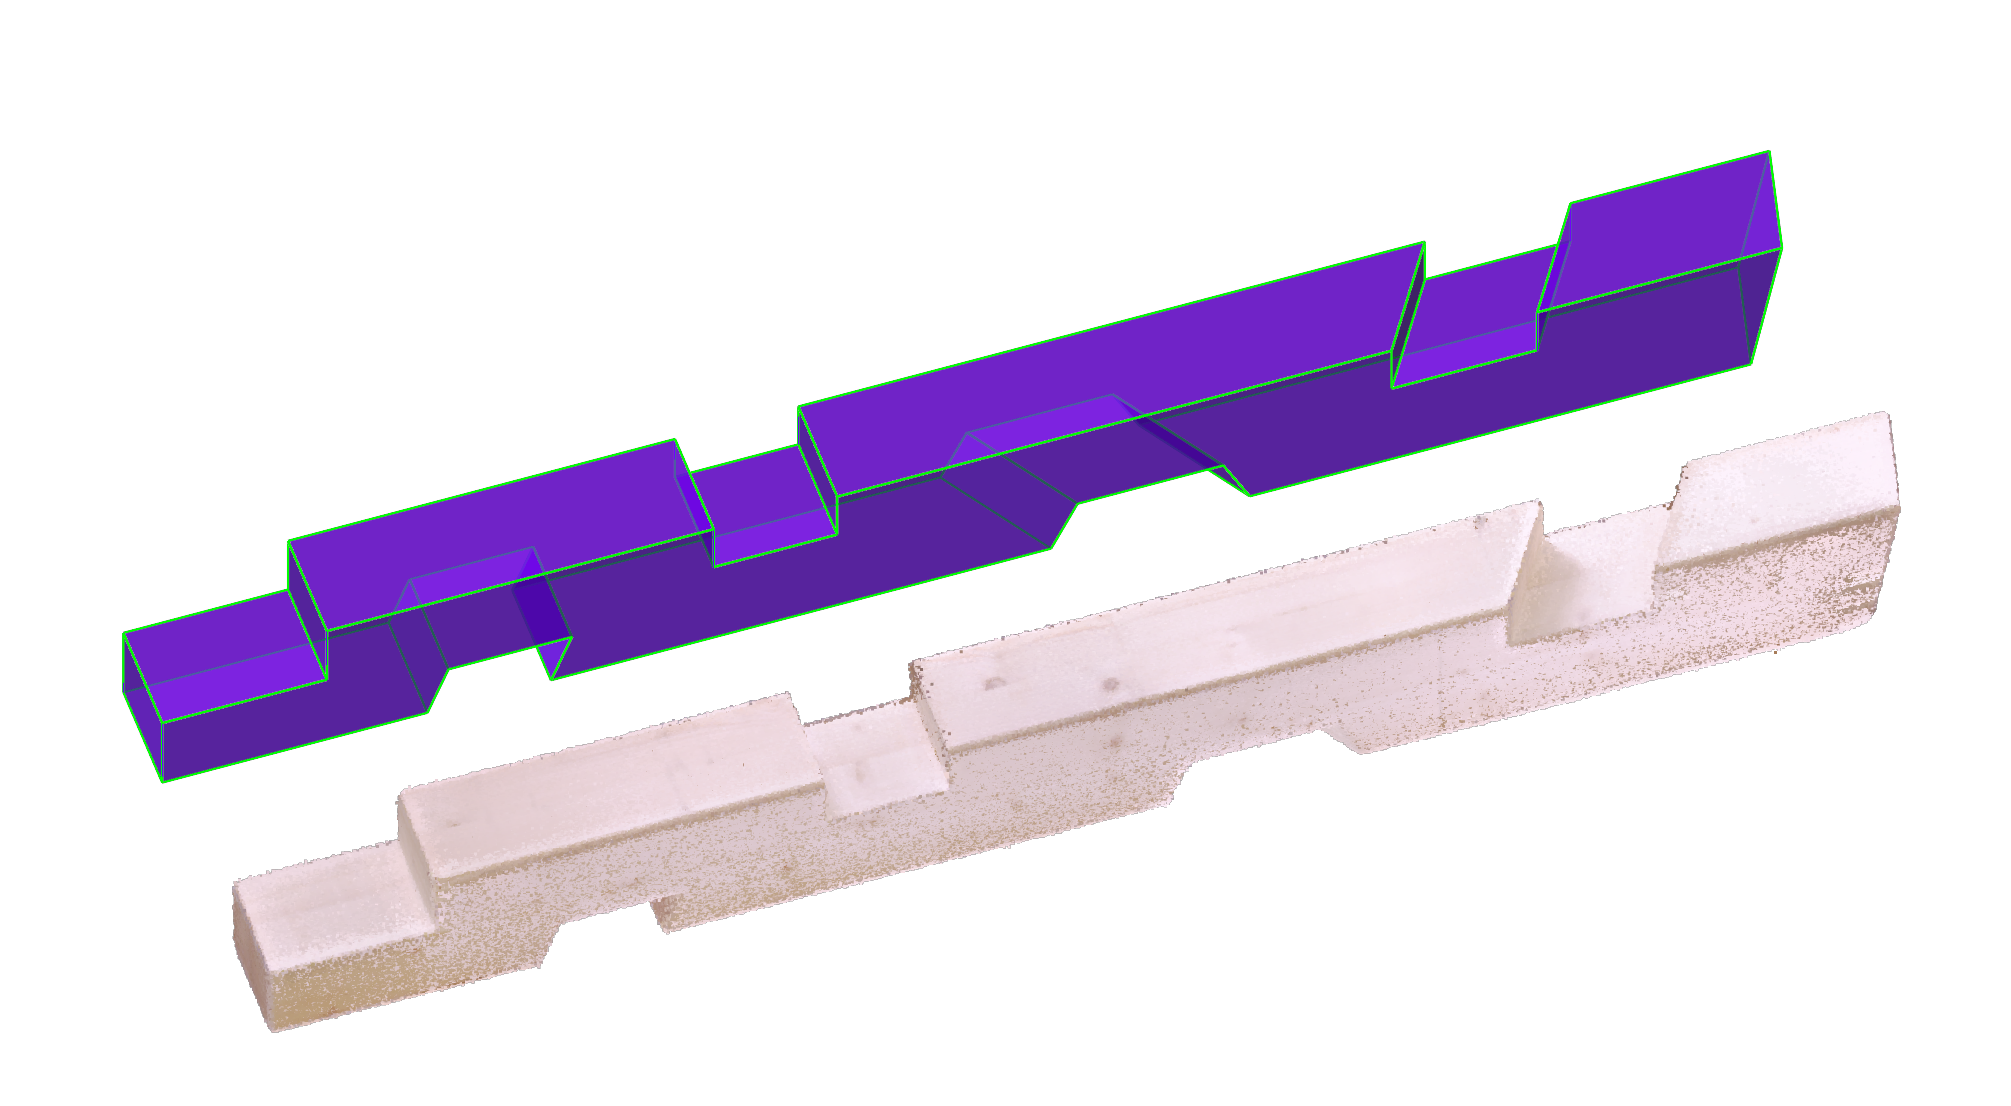
First things first, let’s import your cleaned scan and corresponding polysurface model in Rhino.
2. Build the DFAssembly#
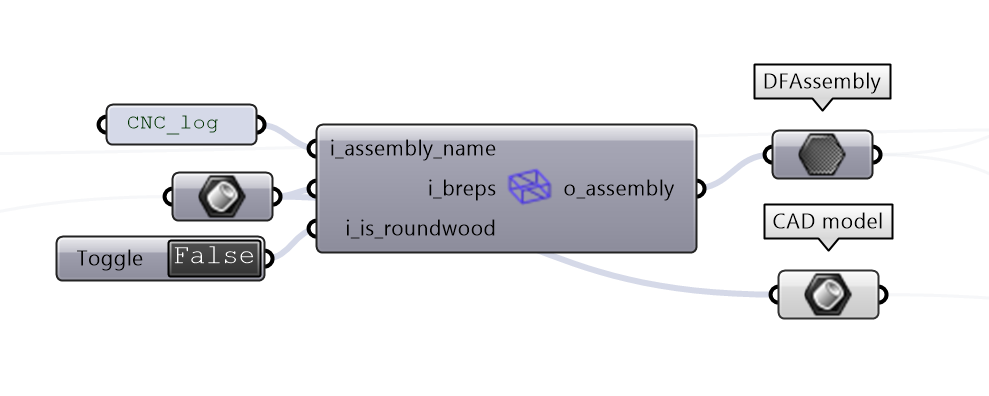
Here we convert the model of our structure into the internal datatype of diffcheck, DFAssembly. This component detects the joints and their faces.
Hint
If you are evaluating round sections e.g. logs, you can set the i_is_roundwood input to True in the DFBuildAssembly component. This will allow DF to detect automatically the joints on the roundwood.
DF’s components:
3. Registration of CAD and scan#
The registration is the process of aligning the CAD model with the scan. This is done by selecting corresponding points on the CAD model and the scan and find a transformation that minimizes the distance between them.

4. Segmentation of the scan#
Once the scan and the CAD model are aligned, we can segment the scan to isolate the parts of the raw point cloud of the scan that corresponds tothe joints.

6. Error computation#
At this point we can compute the error between the CAD model and the scan. The error is computed as the distance between the closest point on the CAD model and the scan. The current DF’s output metrics are:
distance : the distance between the closest point on the CAD model and the scan
mean : the mean distance between the closest point on the CAD model and the scan
max_deviation : the maximum distance between the closest point on the CAD model and the scan
min_deviation : the minimum distance between the closest point on the CAD model and the scan
std_deviation : the standard deviation of the distance between the closest point on the CAD model and the scan
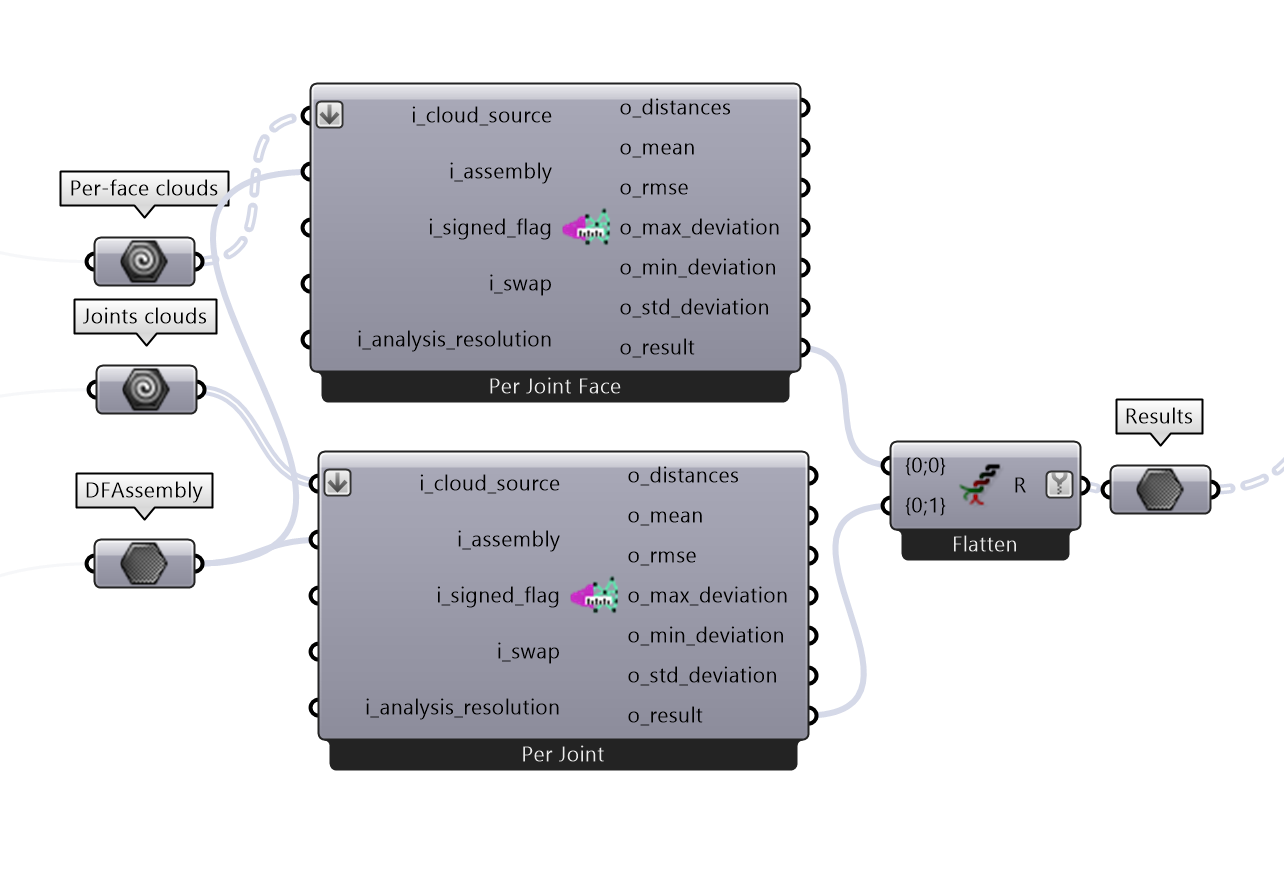
DF’s components:
7. Error Visulization#
DF allows you to quickly visualize the errors in the Rhino viewport. The color of the points represents the distance between the CAD model and the scan. The color scale can be adjusted to better visualize the error. We also provide a graph that shows the distribution of the errors.
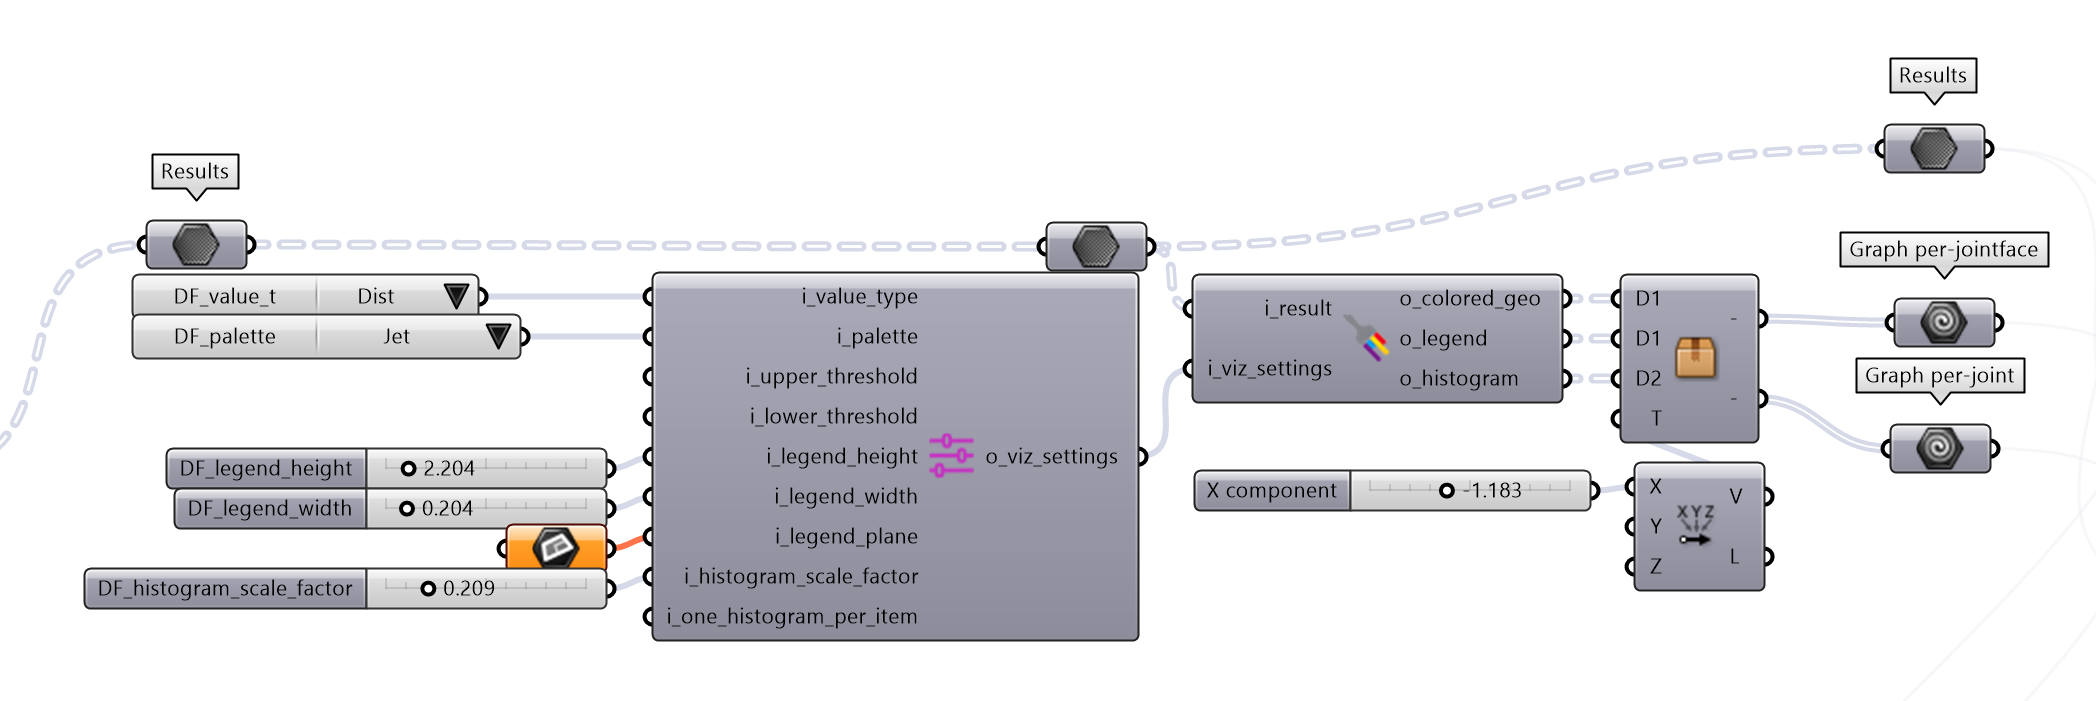
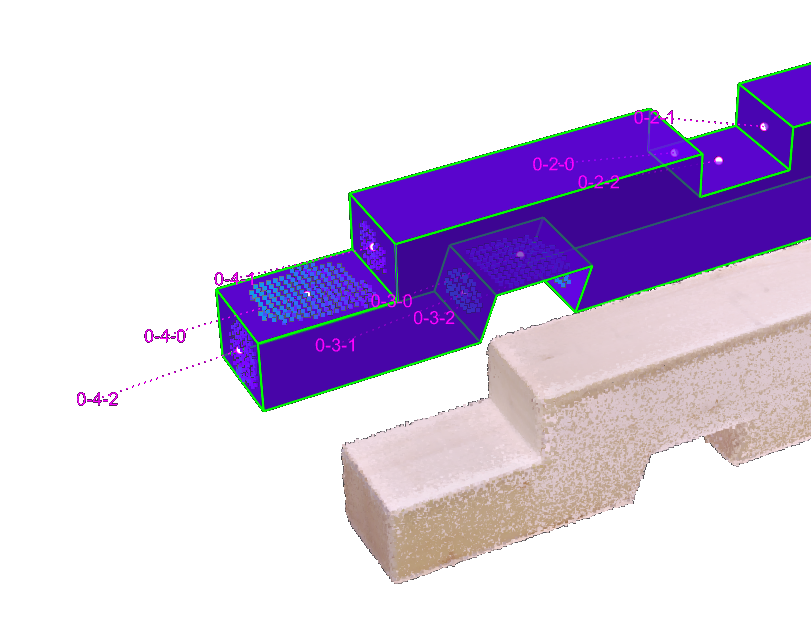
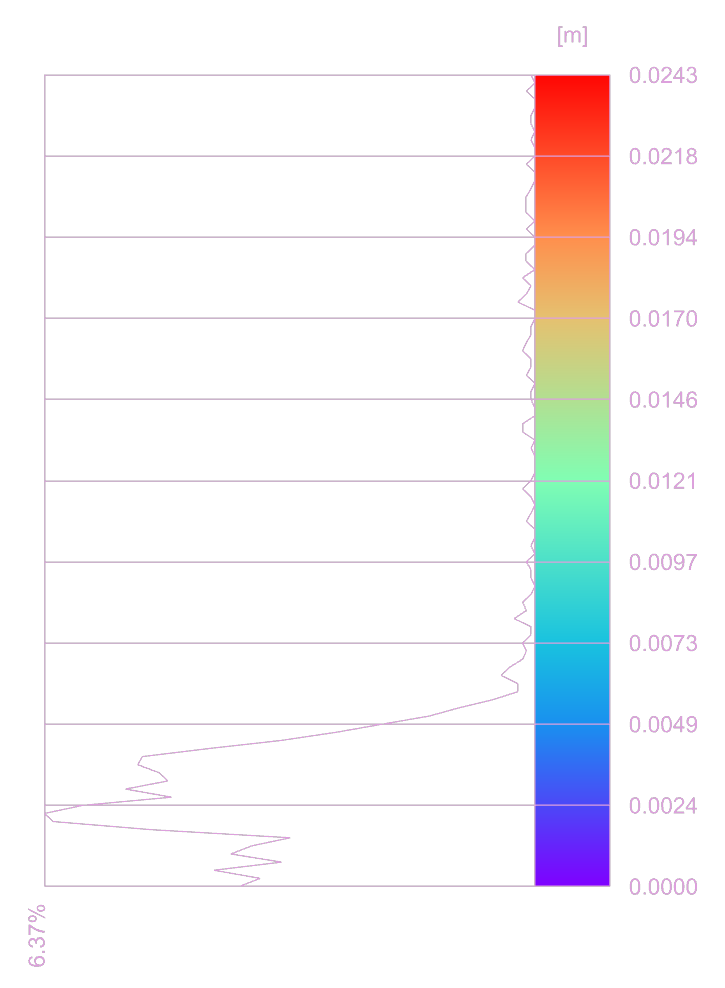
DF’s components:
8. Export the results#
The results can be also exported in a CSV file for further analysis or documentation.
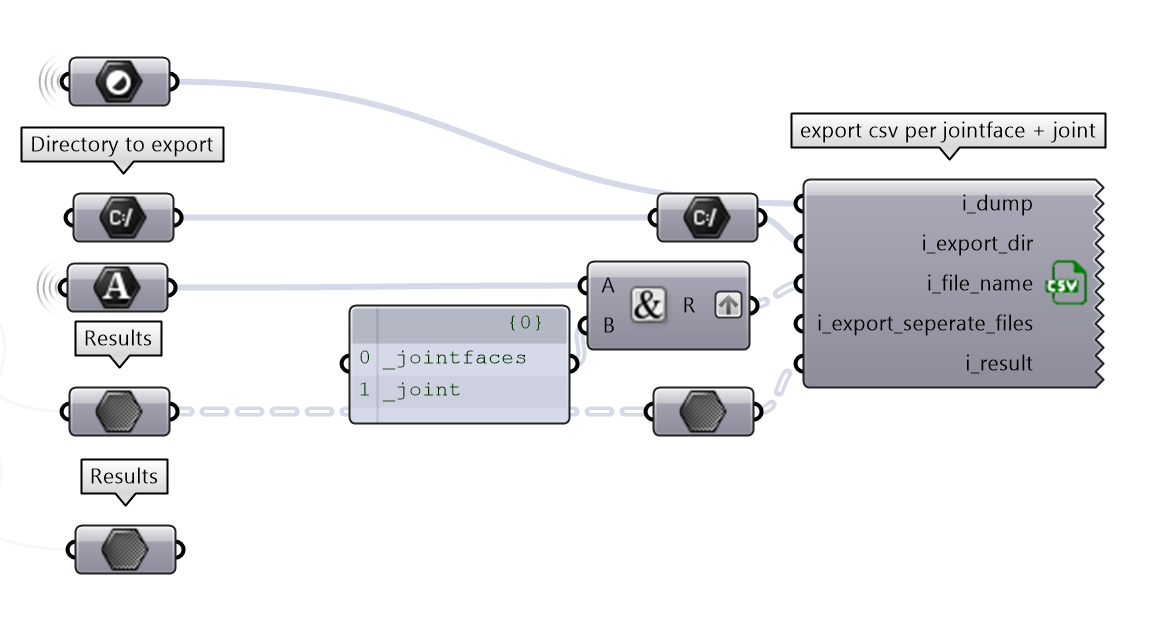
CSV can be exporting the value per joint..
Joint ID |
Min Deviation |
Max Deviation |
Std Deviation |
RMSE |
|---|---|---|---|---|
0–0–0 |
0 |
0.006 |
0.0015 |
0.0023 |
0–1–0 |
0 |
0.0064 |
0.0011 |
0.0024 |
0–2–0 |
0.0001 |
0.0091 |
0.0019 |
0.0028 |
0–3–0 |
0 |
0.0061 |
0.0012 |
0.0018 |
0–4–0 |
0.0001 |
0.0062 |
0.0009 |
0.0021 |
.. or per face
Joint Face ID |
Min Deviation |
Max Deviation |
Std Deviation |
RMSE |
Mean |
|---|---|---|---|---|---|
0–0–0 |
0 |
0.0032 |
0.0006 |
0.0009 |
0.0007 |
0–0–1 |
0.2933 |
0.6587 |
0.1164 |
0.4882 |
0.4741 |
0–0–2 |
MISSING_PCD |
MISSING_PCD |
MISSING_PCD |
MISSING_PCD |
MISSING_PCD |
0–0–3 |
MISSING_PCD |
MISSING_PCD |
MISSING_PCD |
MISSING_PCD |
MISSING_PCD |
0–0–4 |
MISSING_PCD |
MISSING_PCD |
MISSING_PCD |
MISSING_PCD |
MISSING_PCD |
0–0–5 |
MISSING_PCD |
MISSING_PCD |
MISSING_PCD |
MISSING_PCD |
MISSING_PCD |
0–0–6 |
0.2602 |
0.3317 |
0.0171 |
0.2991 |
0.2986 |
0–0–7 |
0.1829 |
0.2453 |
0.0176 |
0.2076 |
0.2069 |
0–0–8 |
0.0107 |
0.2884 |
0.0897 |
0.1512 |
0.1217 |
… |
… |
… |
… |
… |
… |
DF’s components:
