Robotic Assembly#
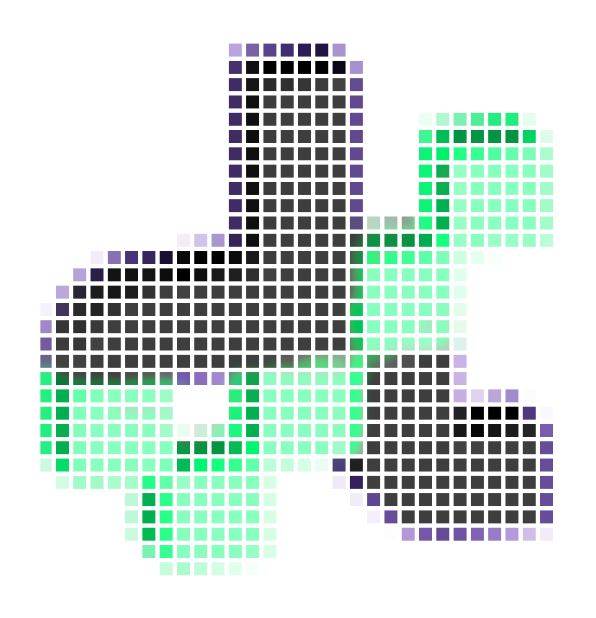
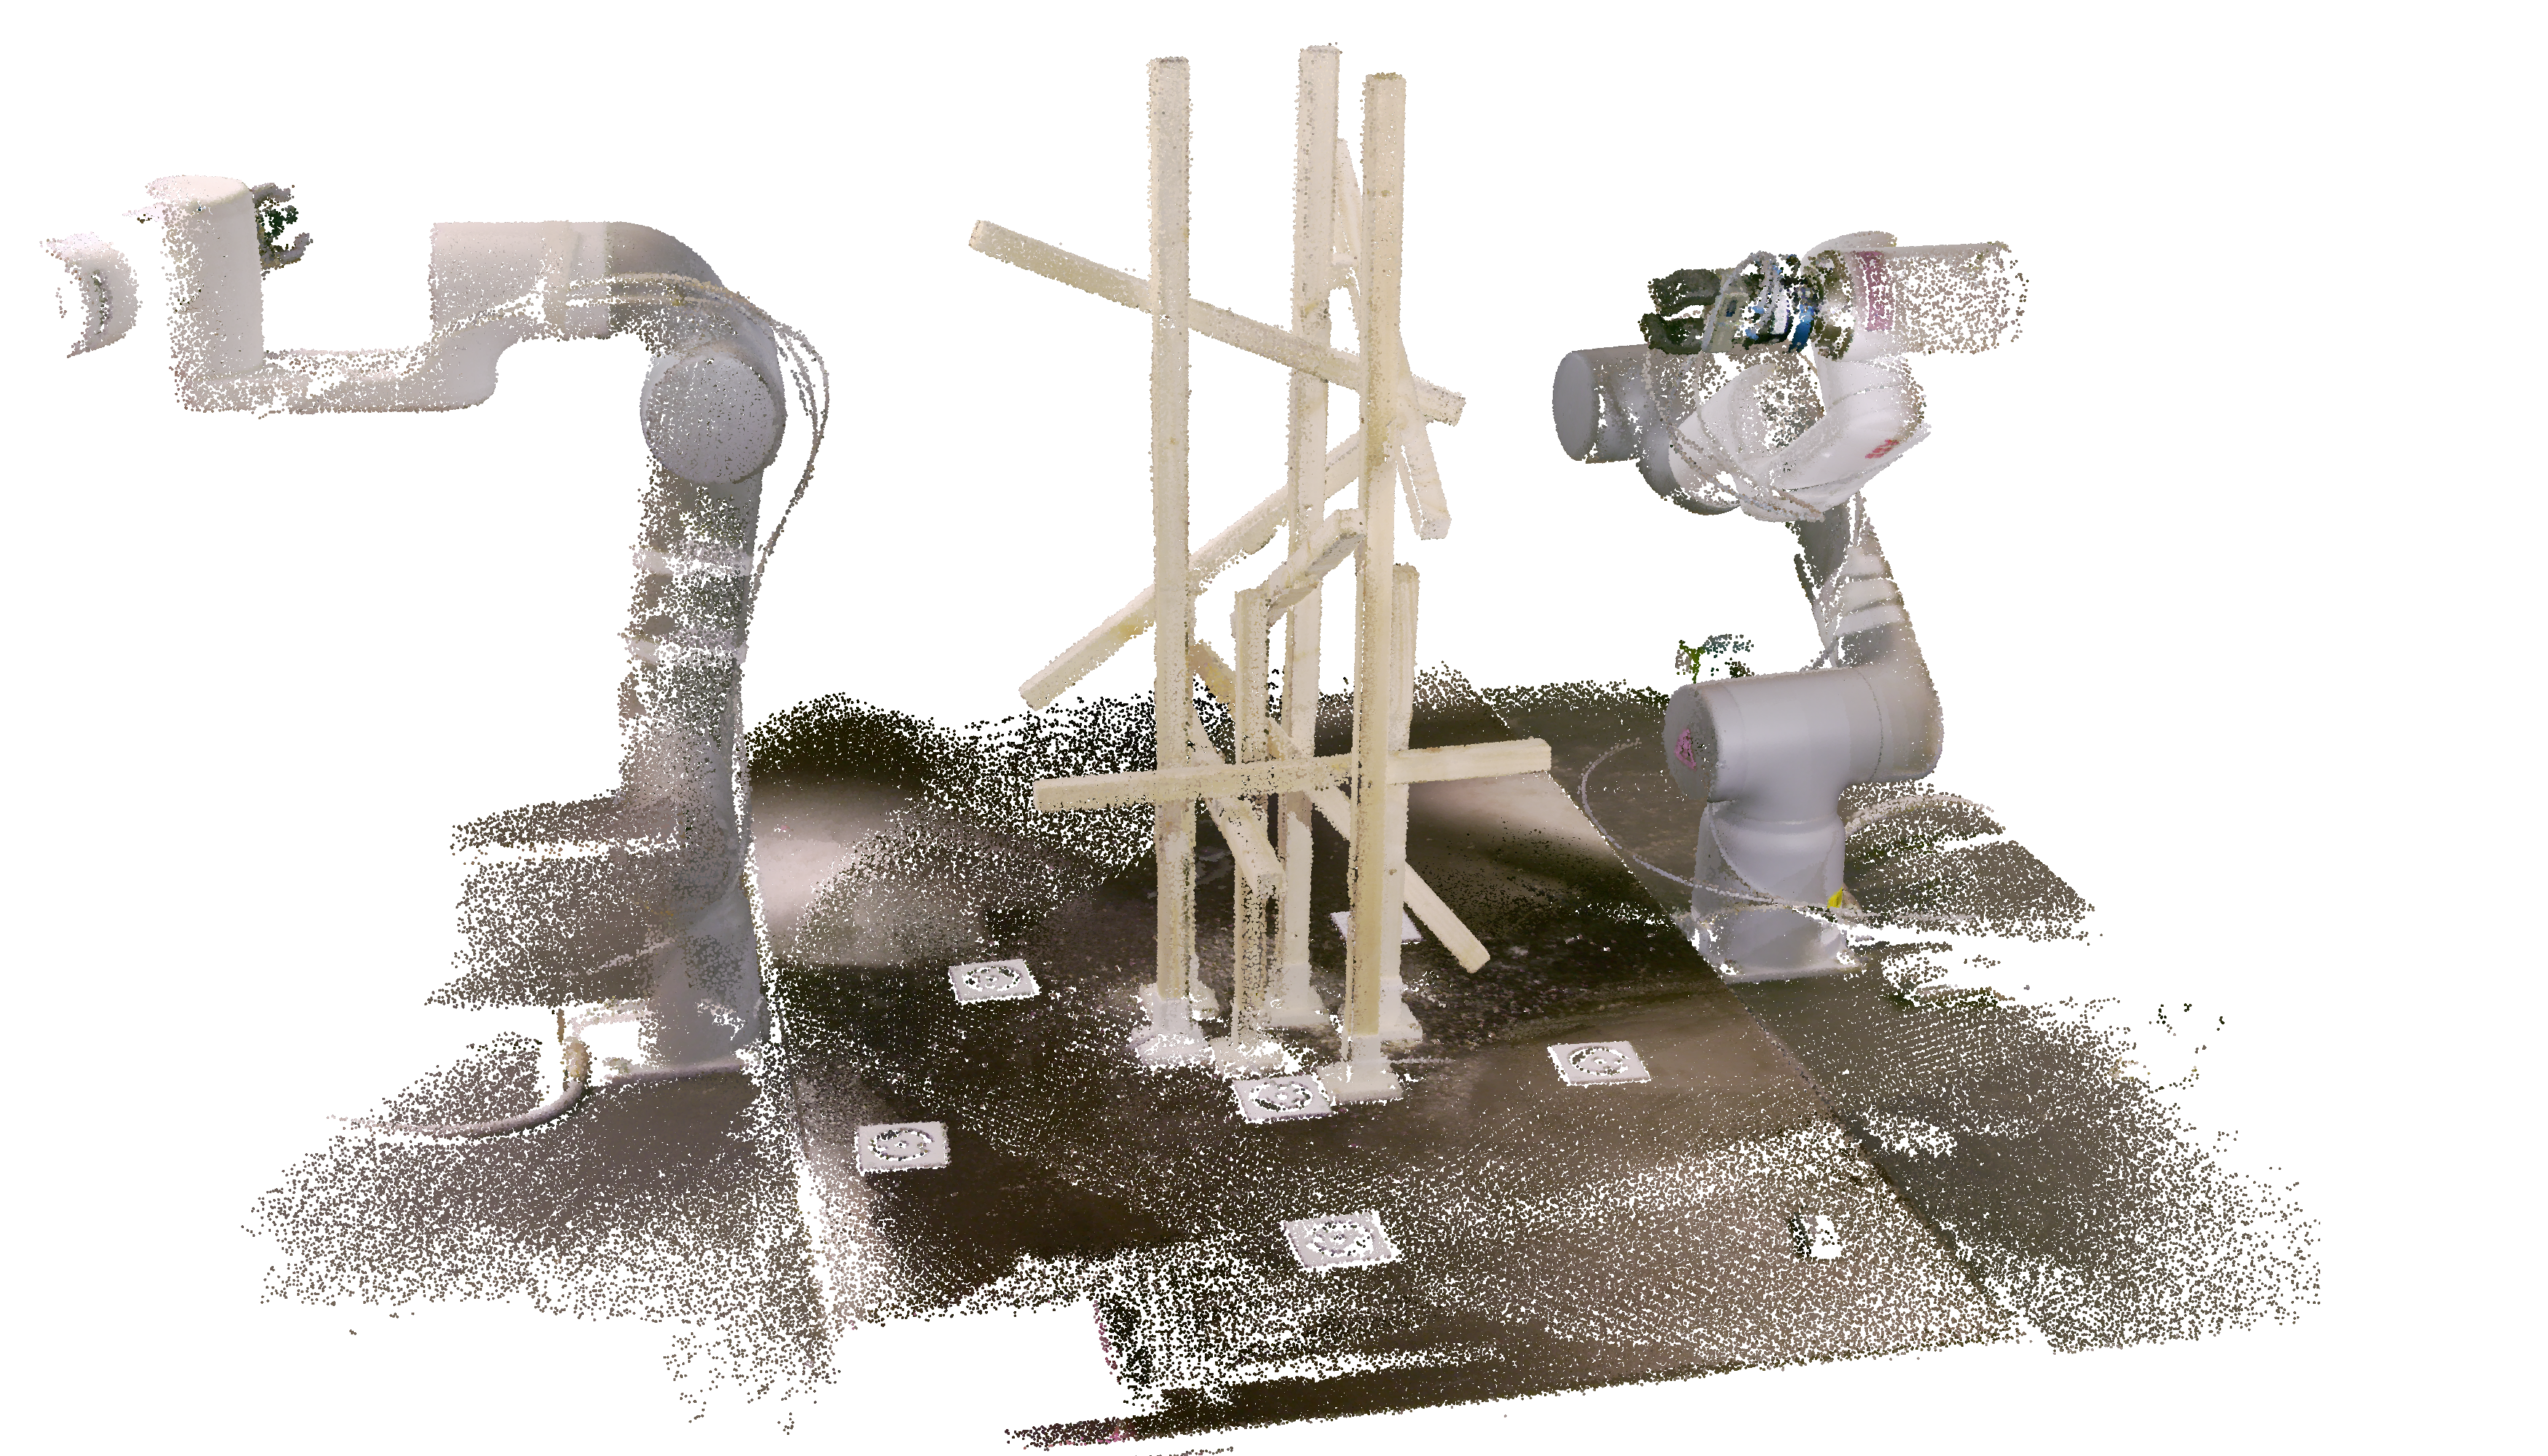
As a studycase for the robotic assembly, we fabricated a spatial structure with a total of thirteen elements of square section connected through bolted face lap joints. The setup included two ABB GoFa CRB 15000-5 and a human.
Steps#
1. Input the data#
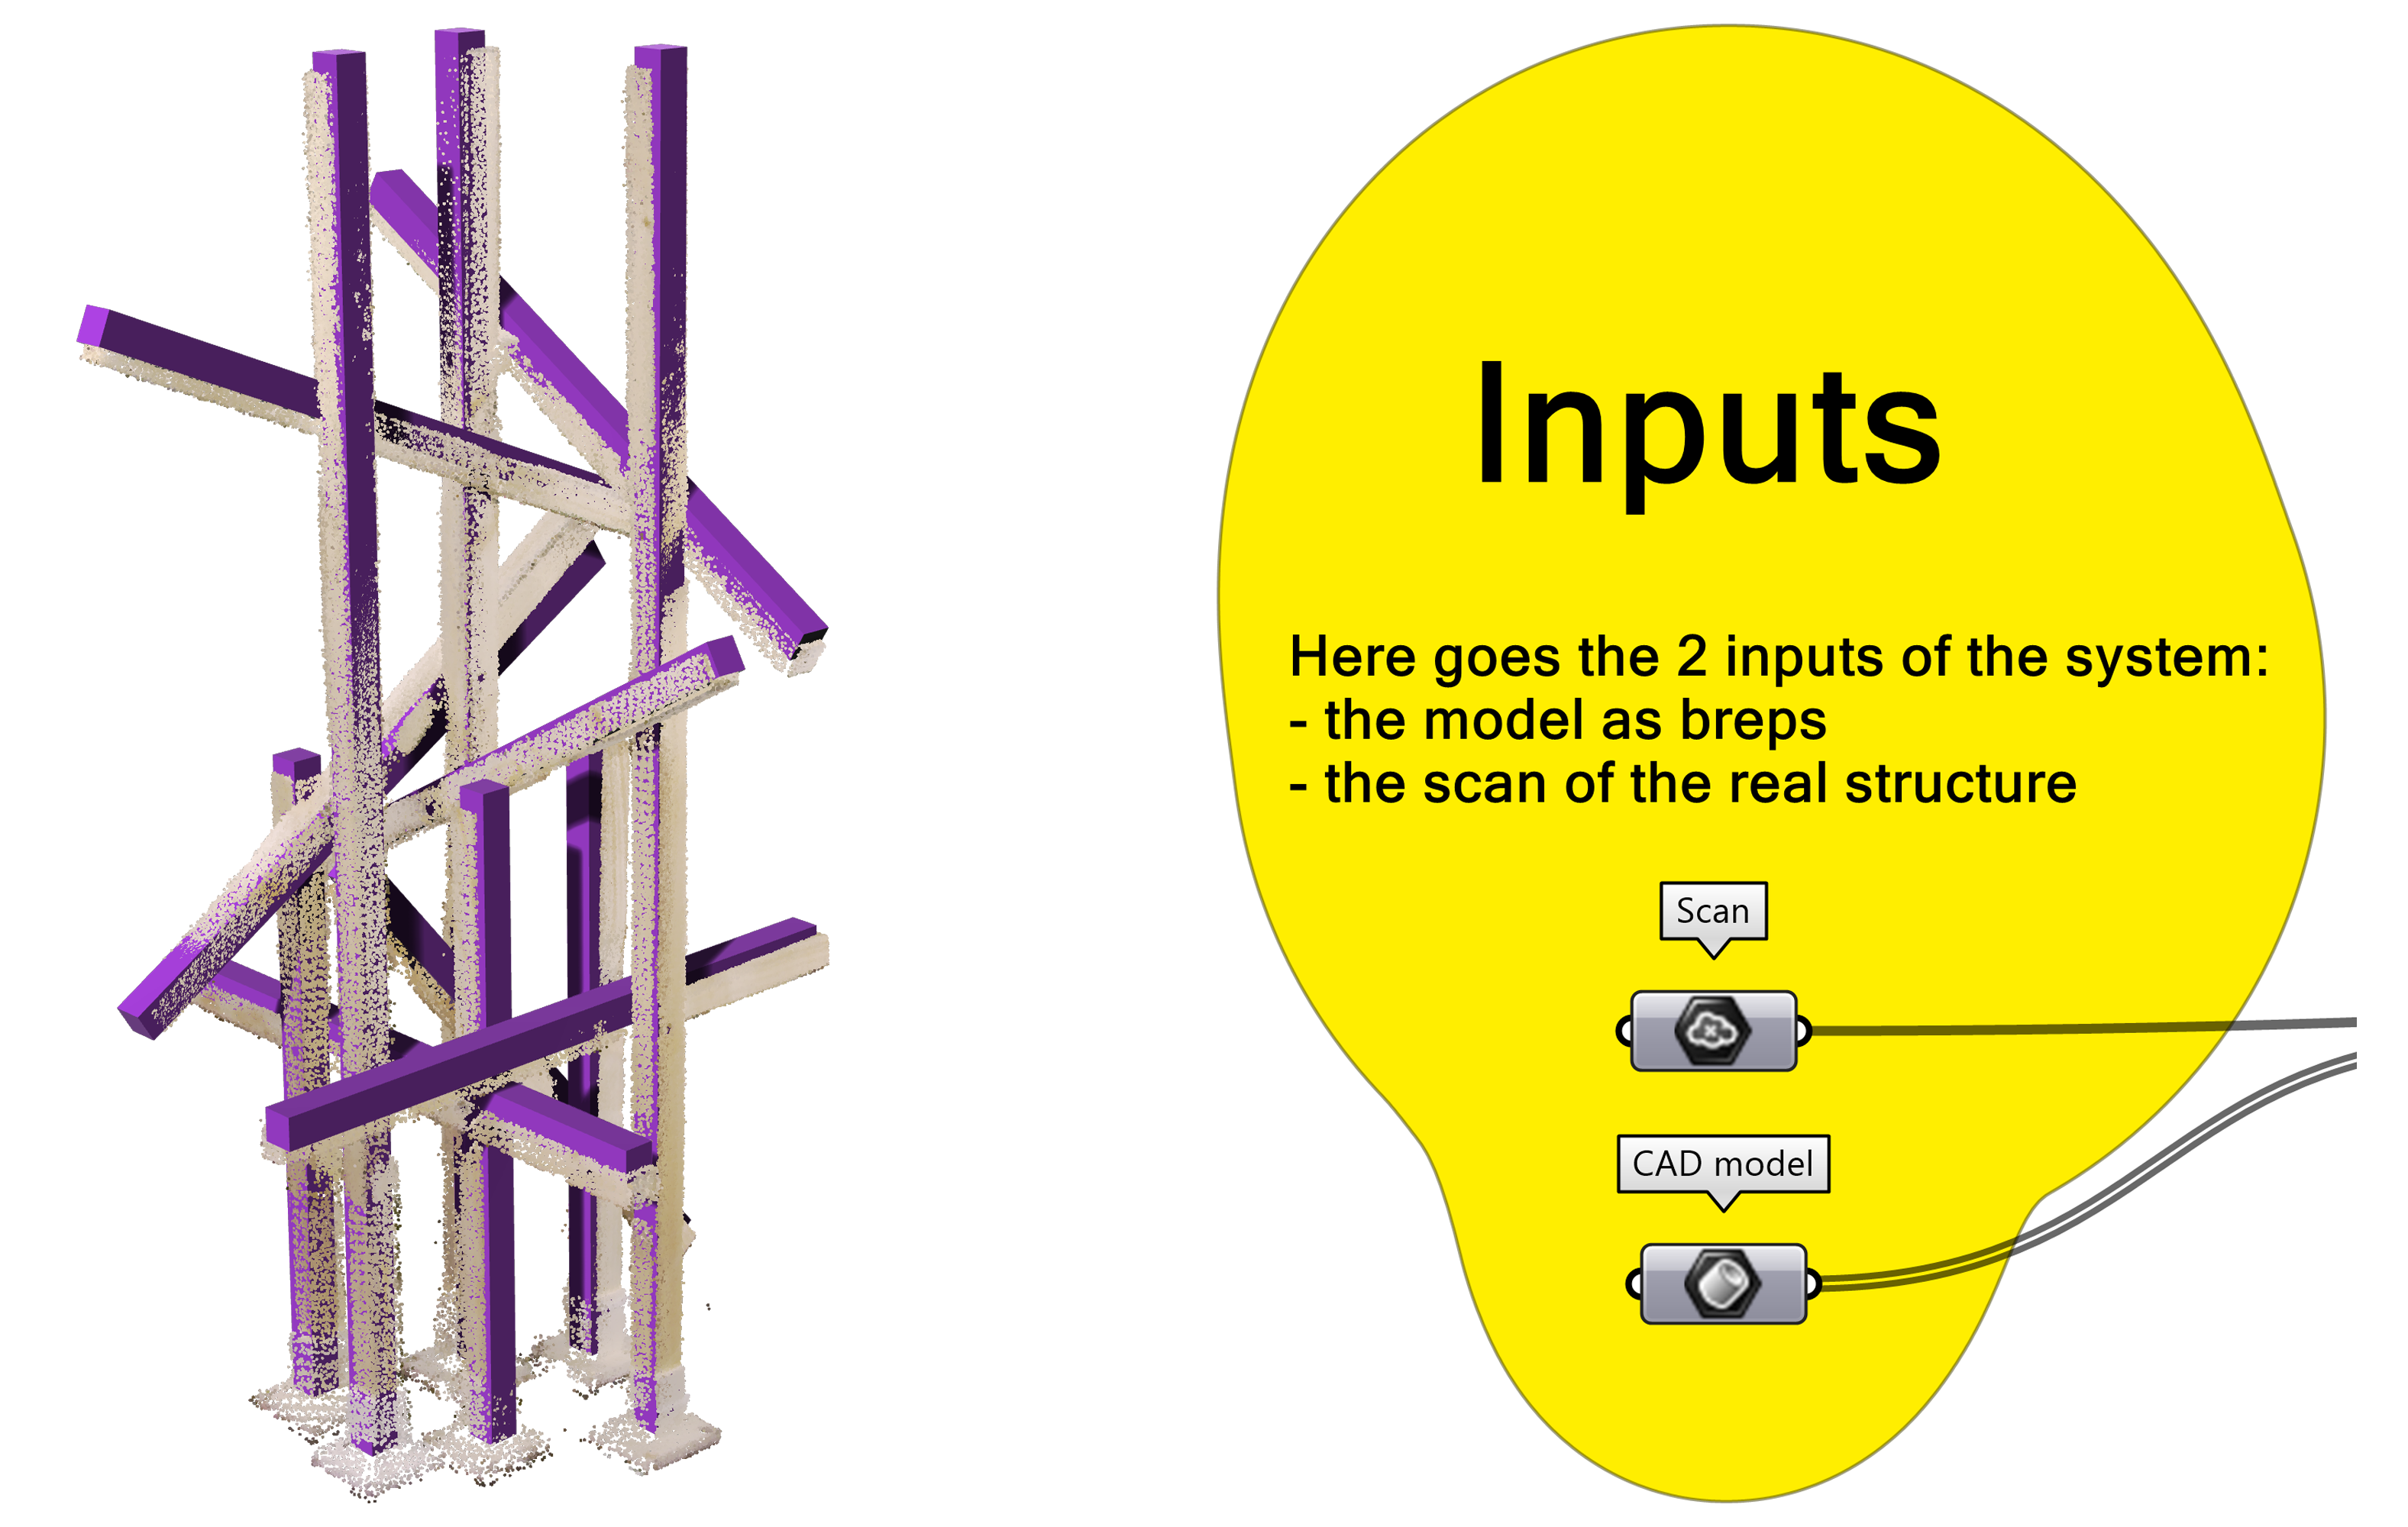
First things first, let’s import your cleaned scan and corresponding polysurface model in Rhino. For this tutorial, we assume that the two are already aligned to each other as the location of the robotically assembled structure is known.
2. Build the DFAssembly#
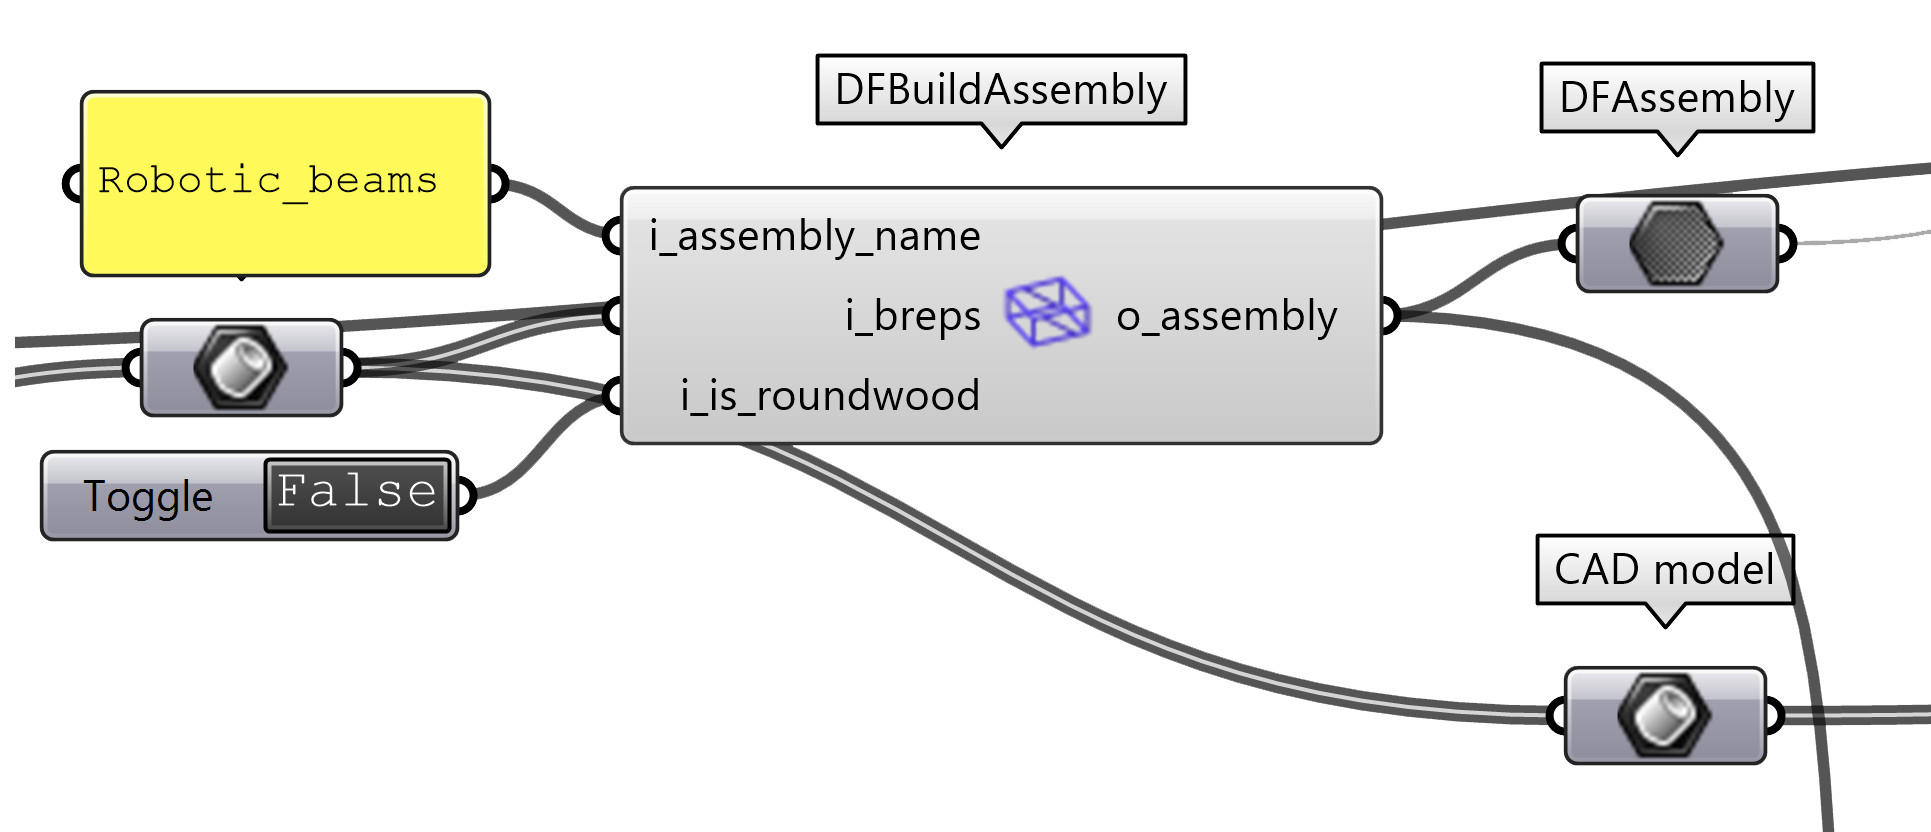
Here we convert the model of our structure into the internal datatype of diffcheck, DFAssembly.
DF’s components:
3.Preparation of CAD and scan data#
We get the pointcloud for the CAD, reduce them to decrease the computation time and compute the normals which is necessary for the next step.

Hint
We assume that the tranformation between the scan and the CAD model is known. If this is not the case, refer to the Registration step of the Manual Assembly
DF’s components:
4. Segmentation of the scan#
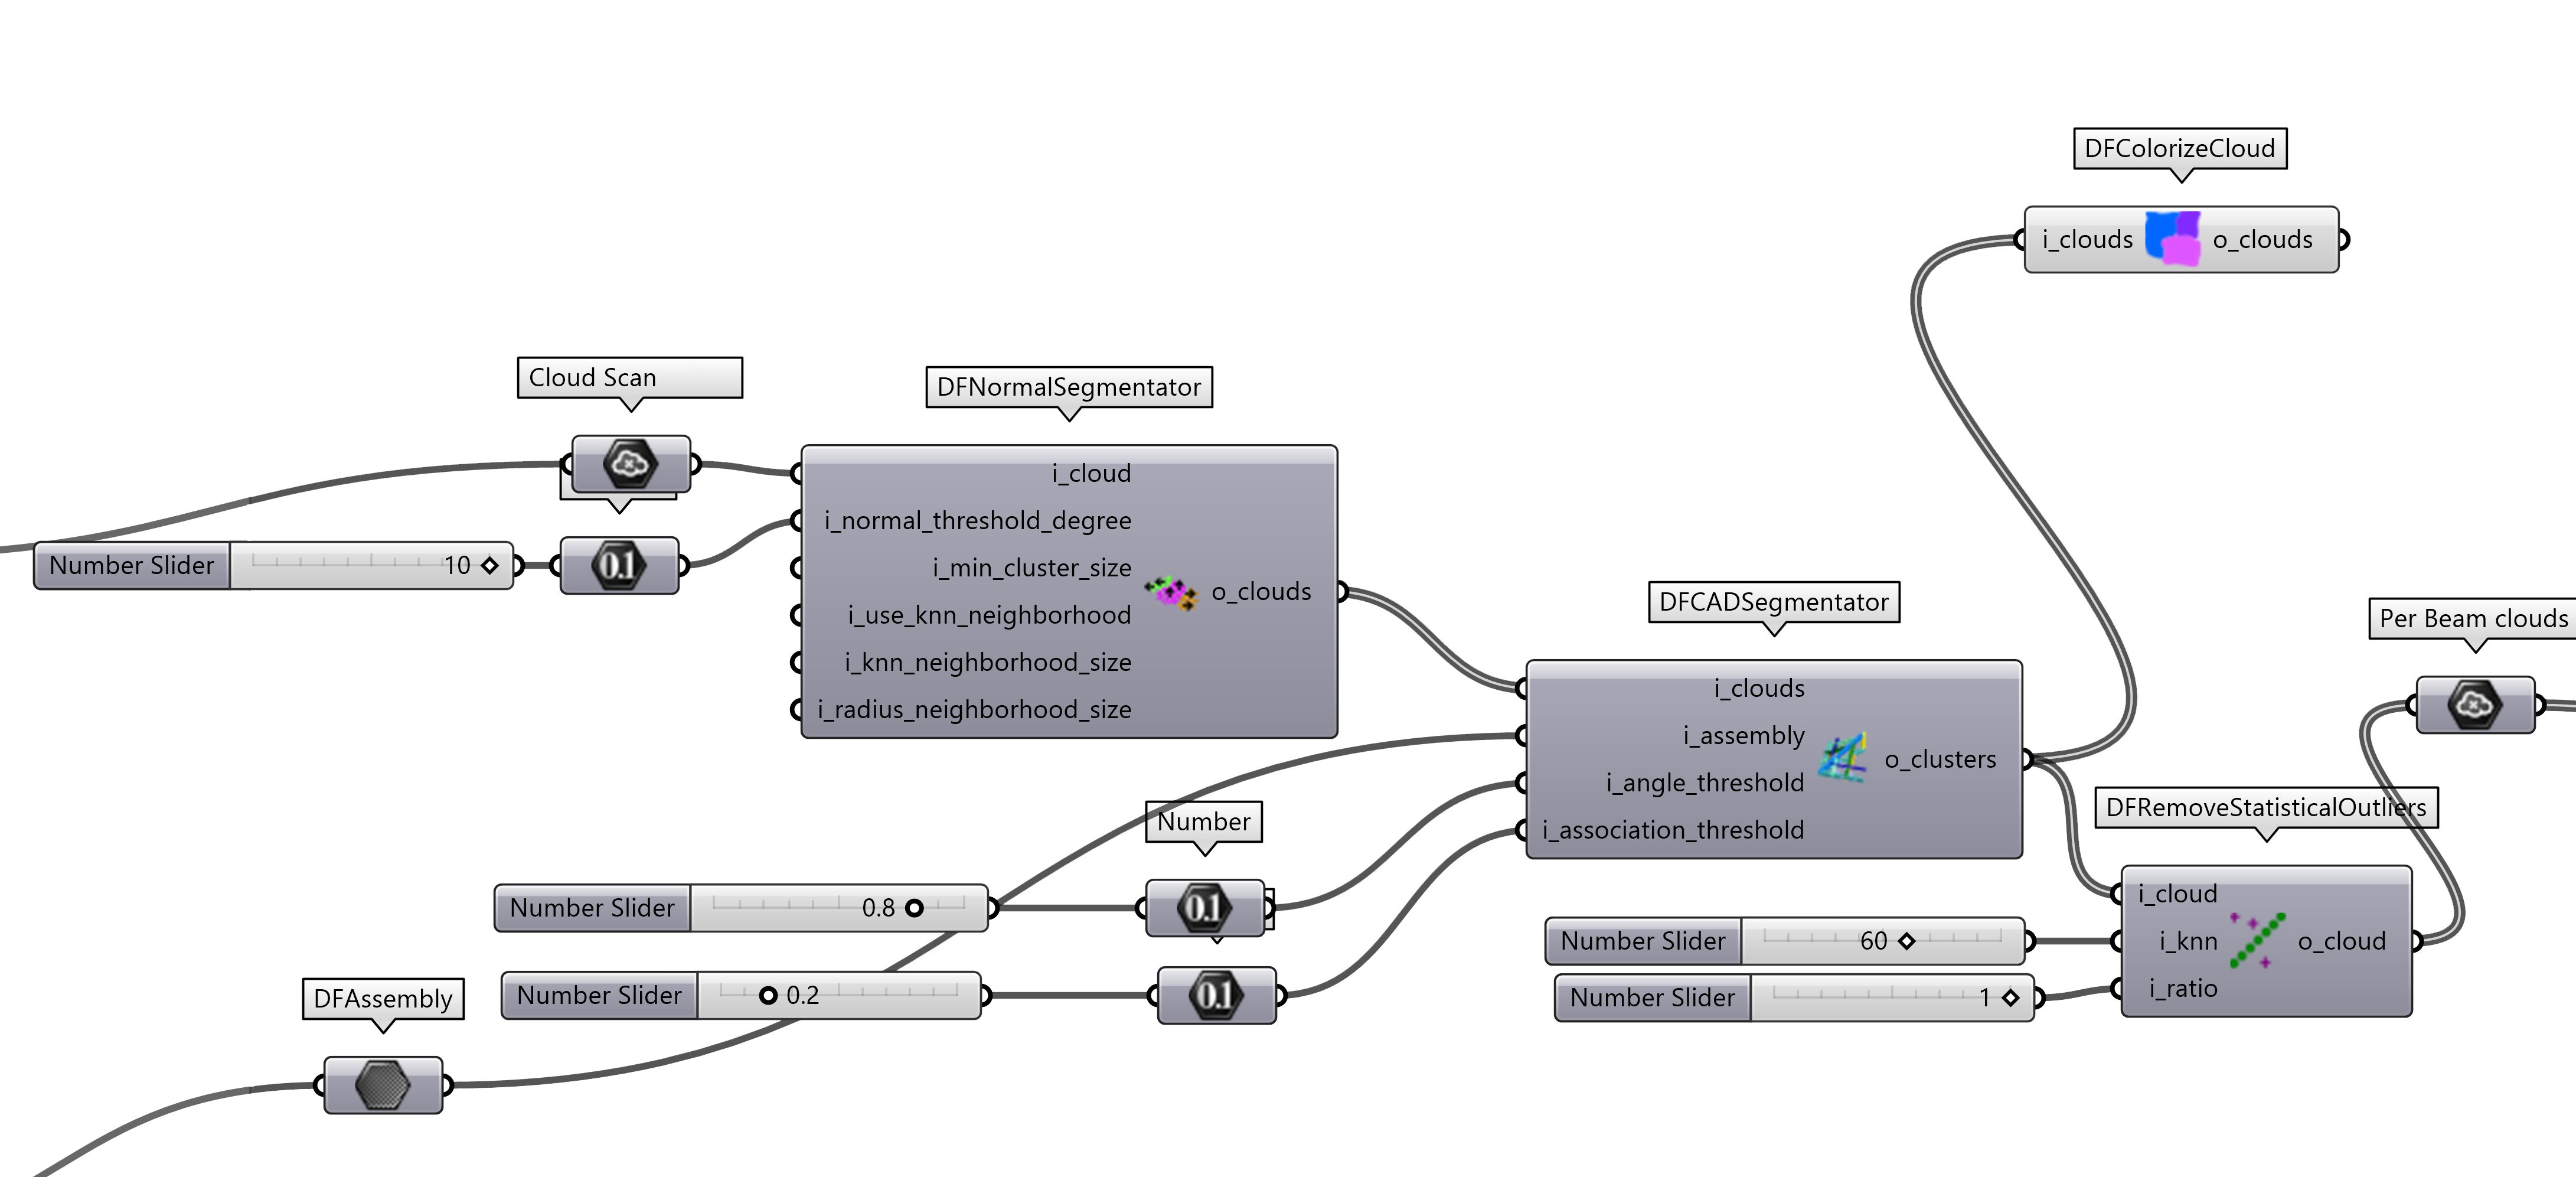
We segment the scan to isolate the parts of the raw point cloud of the scan that correspond to each beam of the assembly.
5. Error computation#
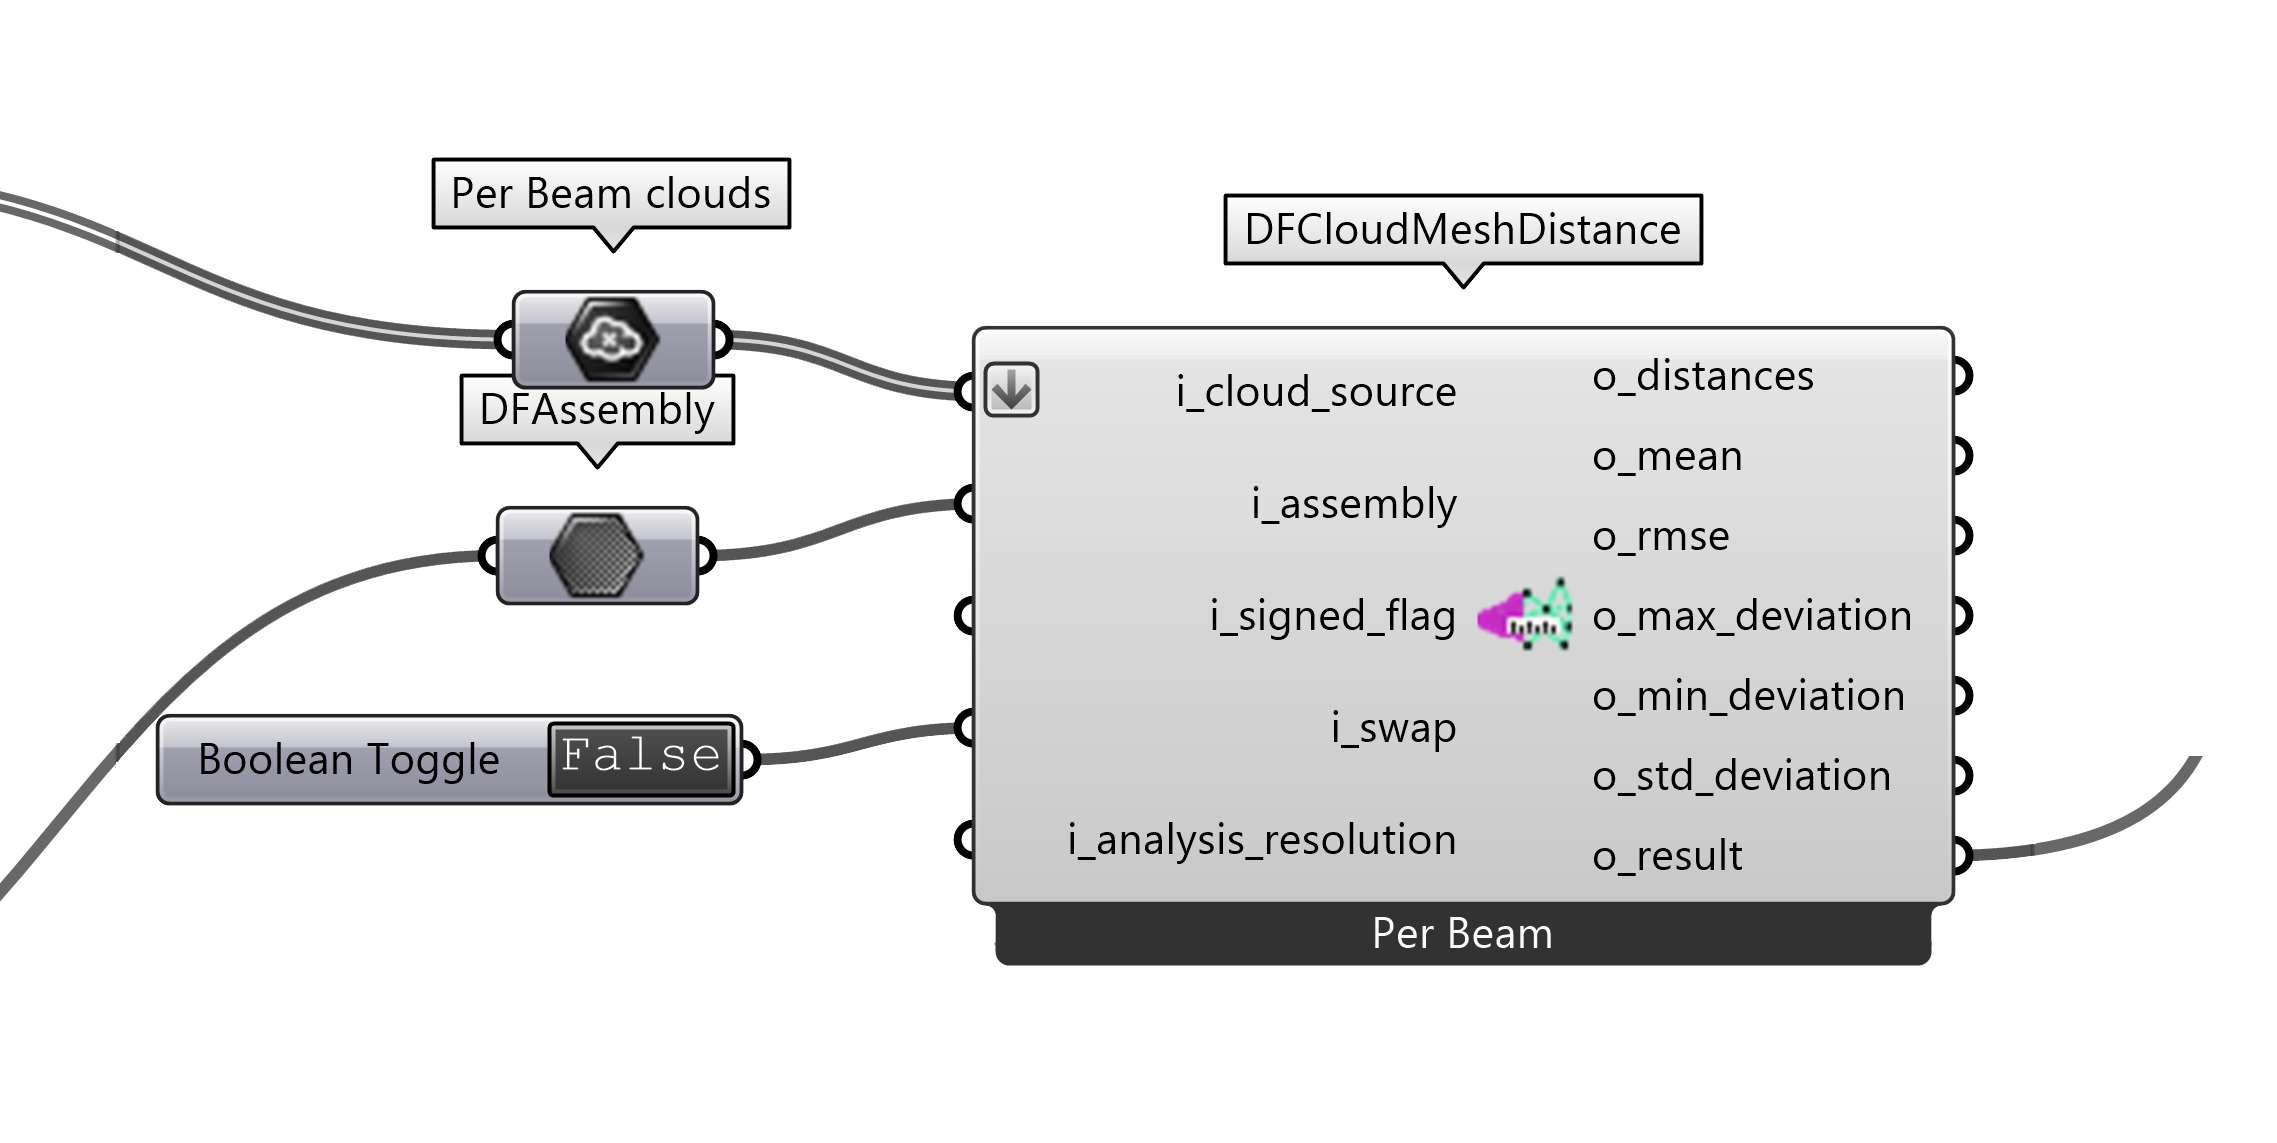
At this point we can compute the error between the CAD model and the scan. The error is computed as the distance between the closest point on the CAD model and the scan. The current DF’s output metrics are:
distance : the distance between the closest point on the CAD model and the scan
mean : the mean distance between the closest point on the CAD model and the scan
max_deviation : the maximum distance between the closest point on the CAD model and the scan
min_deviation : the minimum distance between the closest point on the CAD model and the scan
std_deviation : the standard deviation of the distance between the closest point on the CAD model and the scan
DF’s components:
6. Error Visulization#
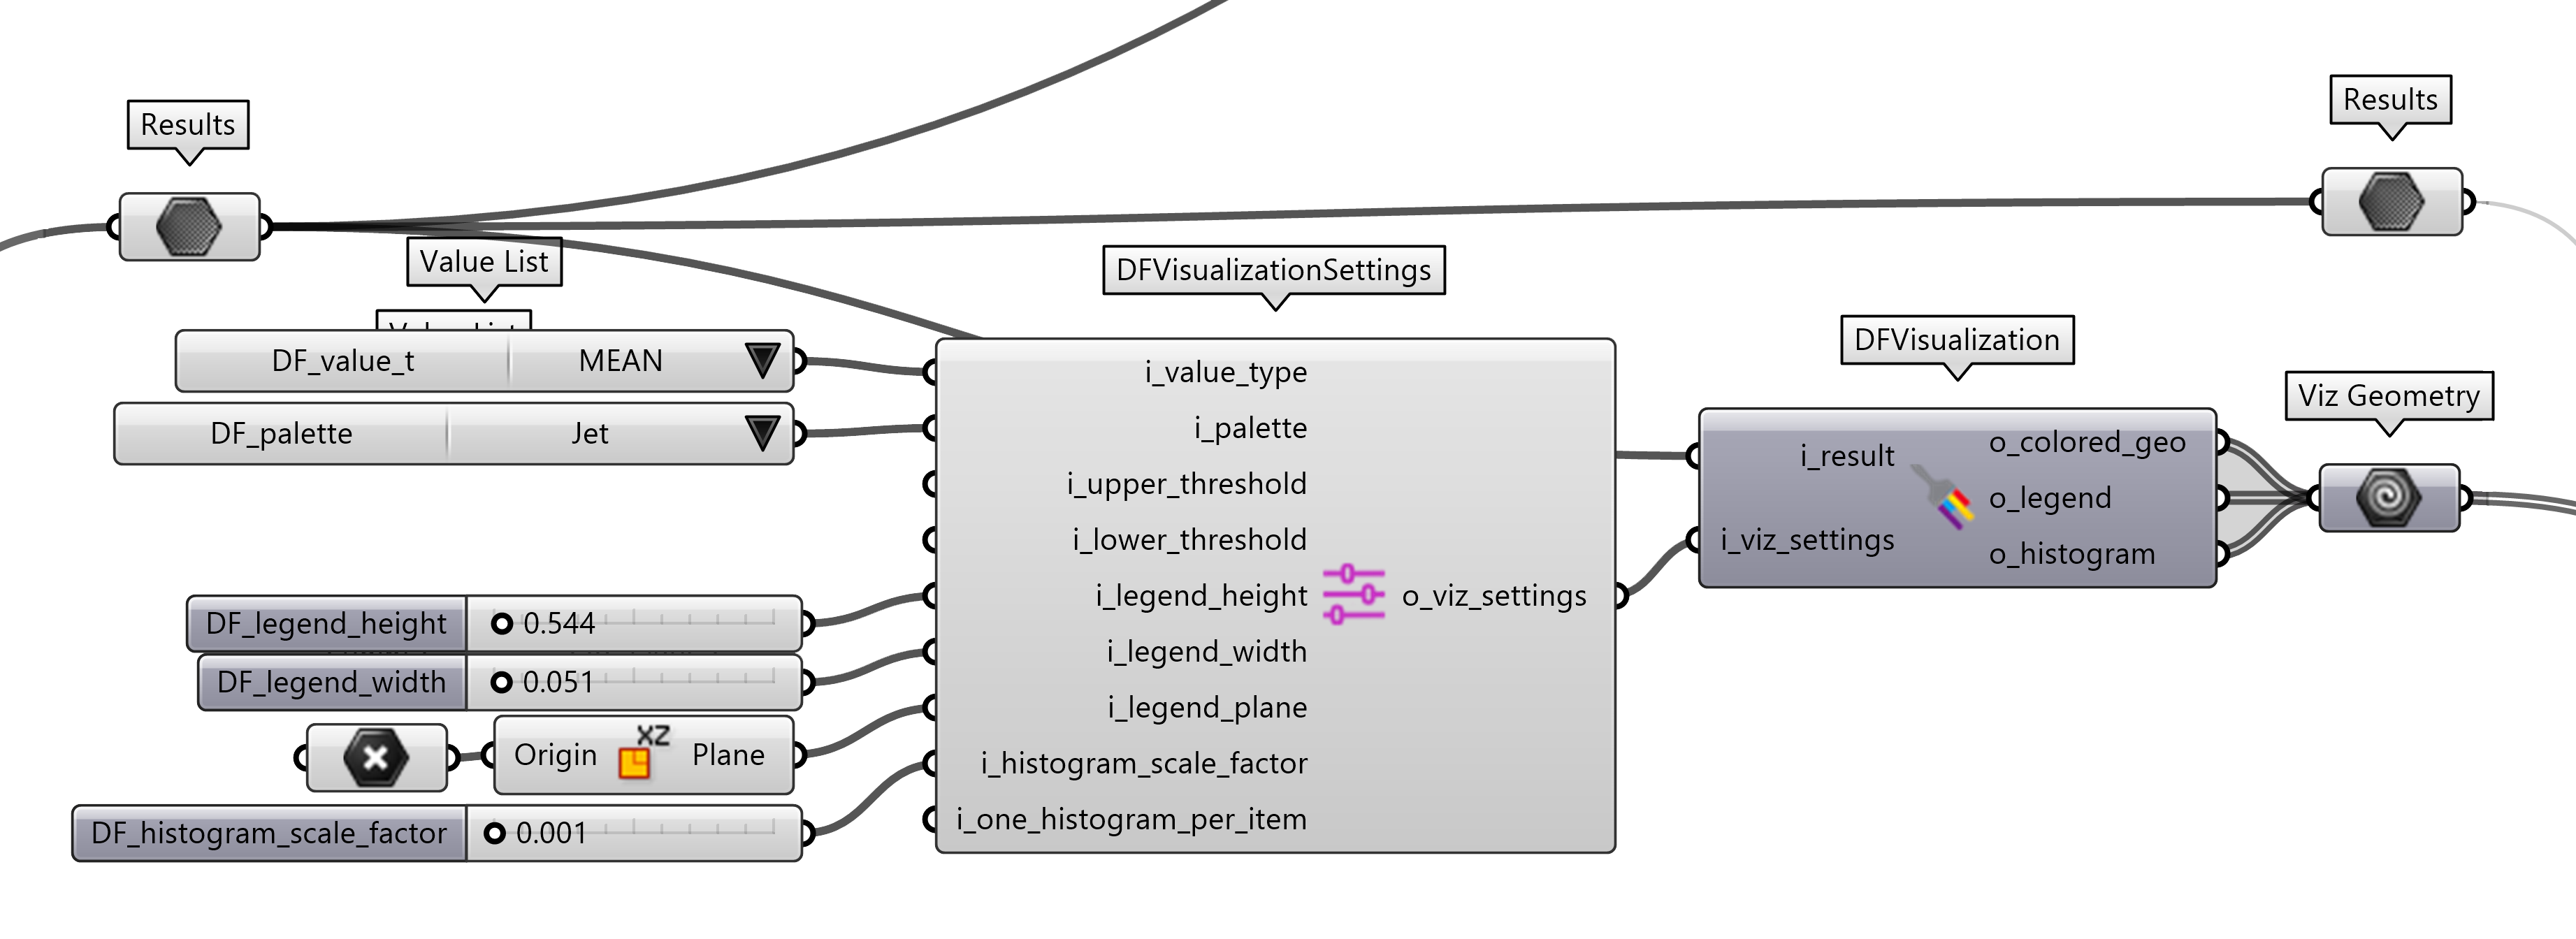
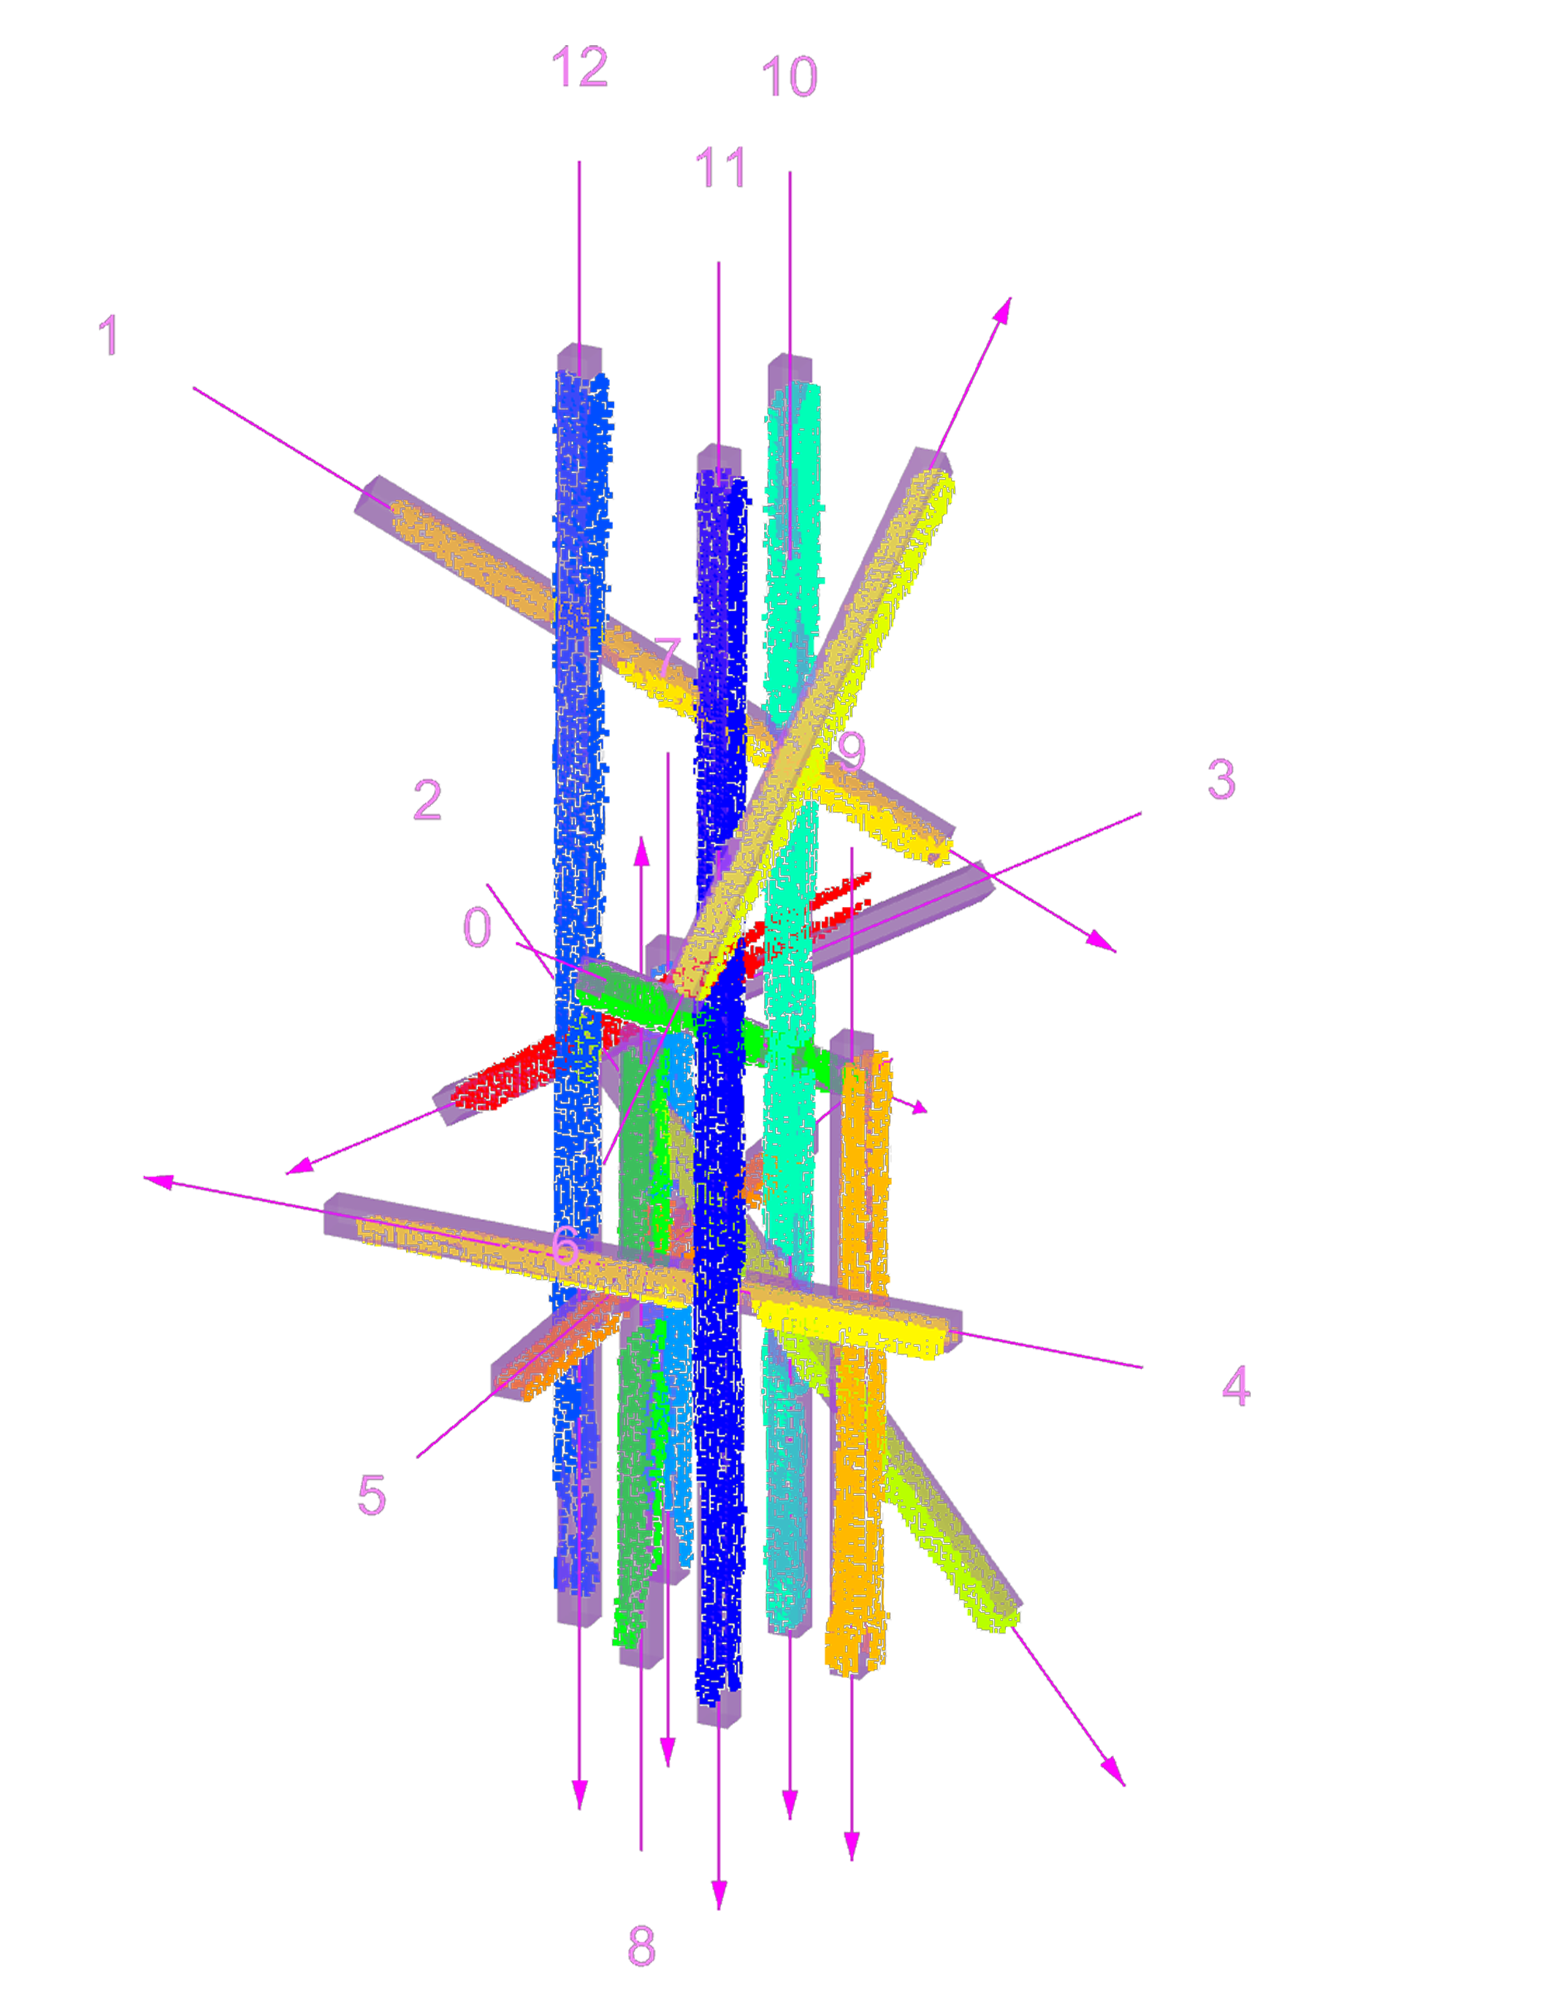
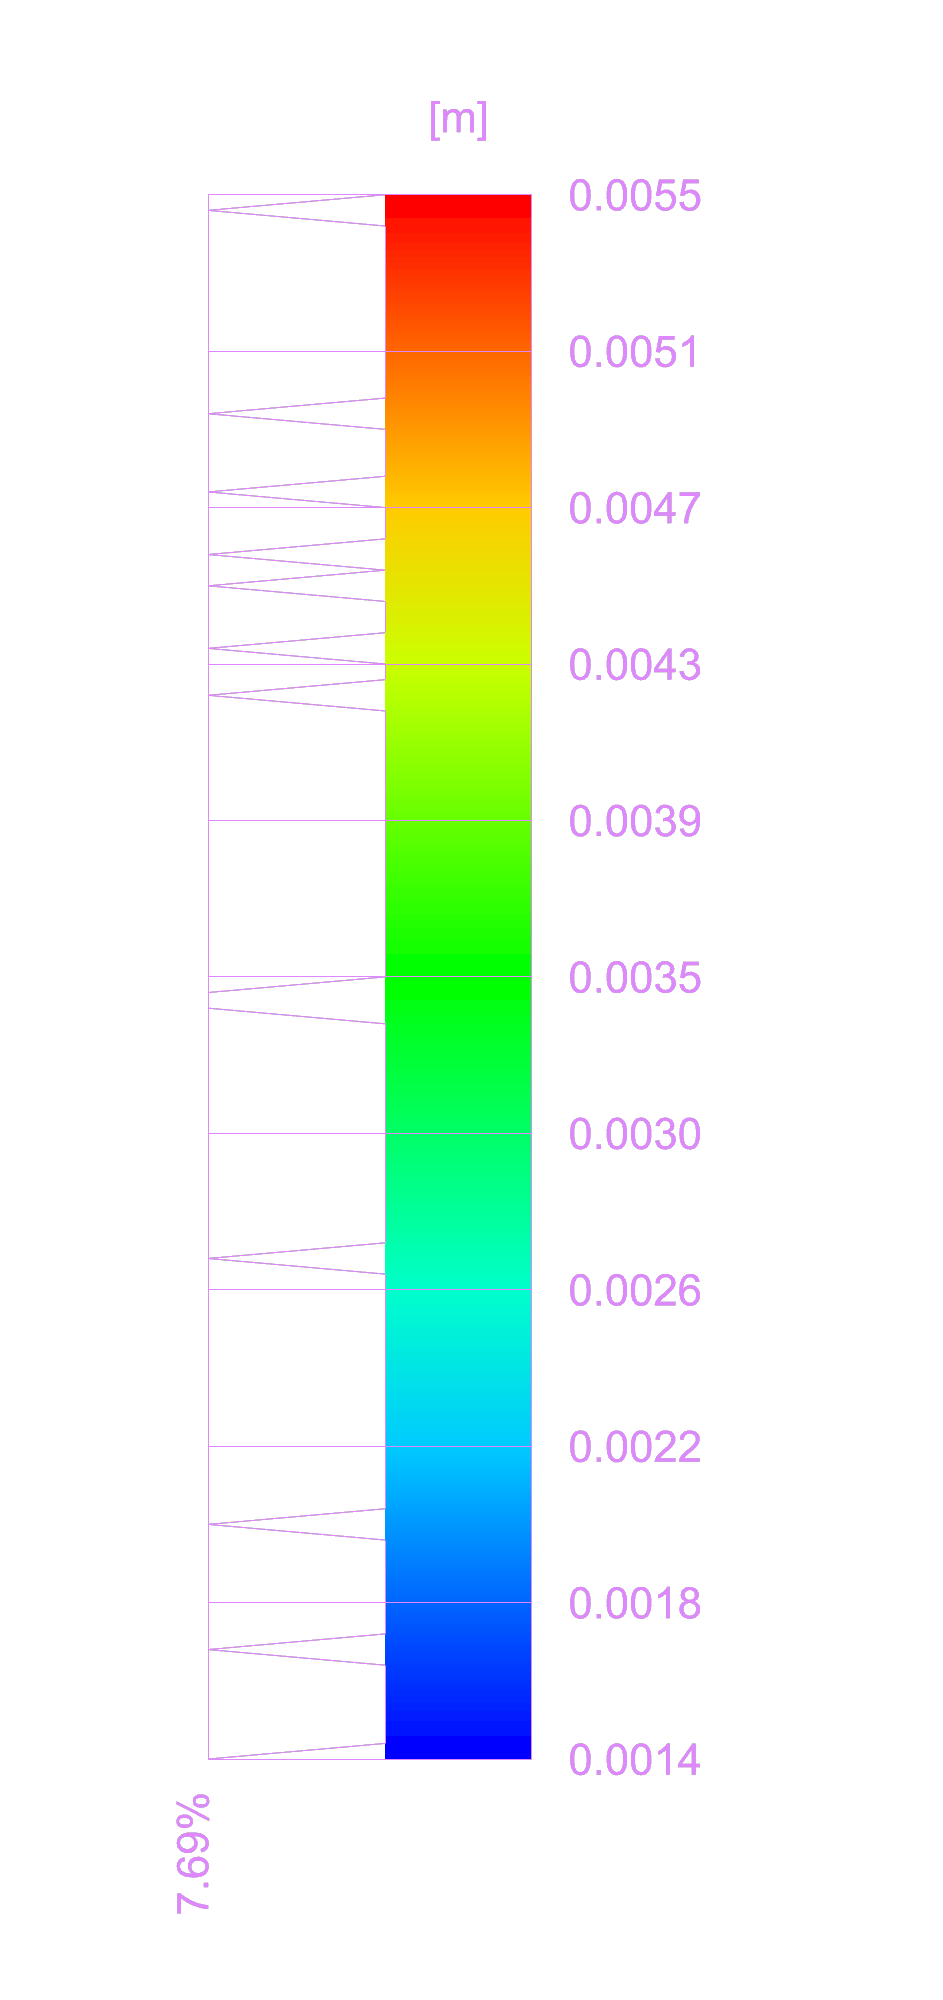
DF allows you to quickly visualize the errors in the Rhino viewport. The color of the points represents the distance between the CAD model and the scan. The color scale can be adjusted to better visualize the error. We also provide a graph that shows the distribution of the errors.
DF’s components:
7. Export the results#
The results can be also exported in a CSV file for further analysis or documentation.
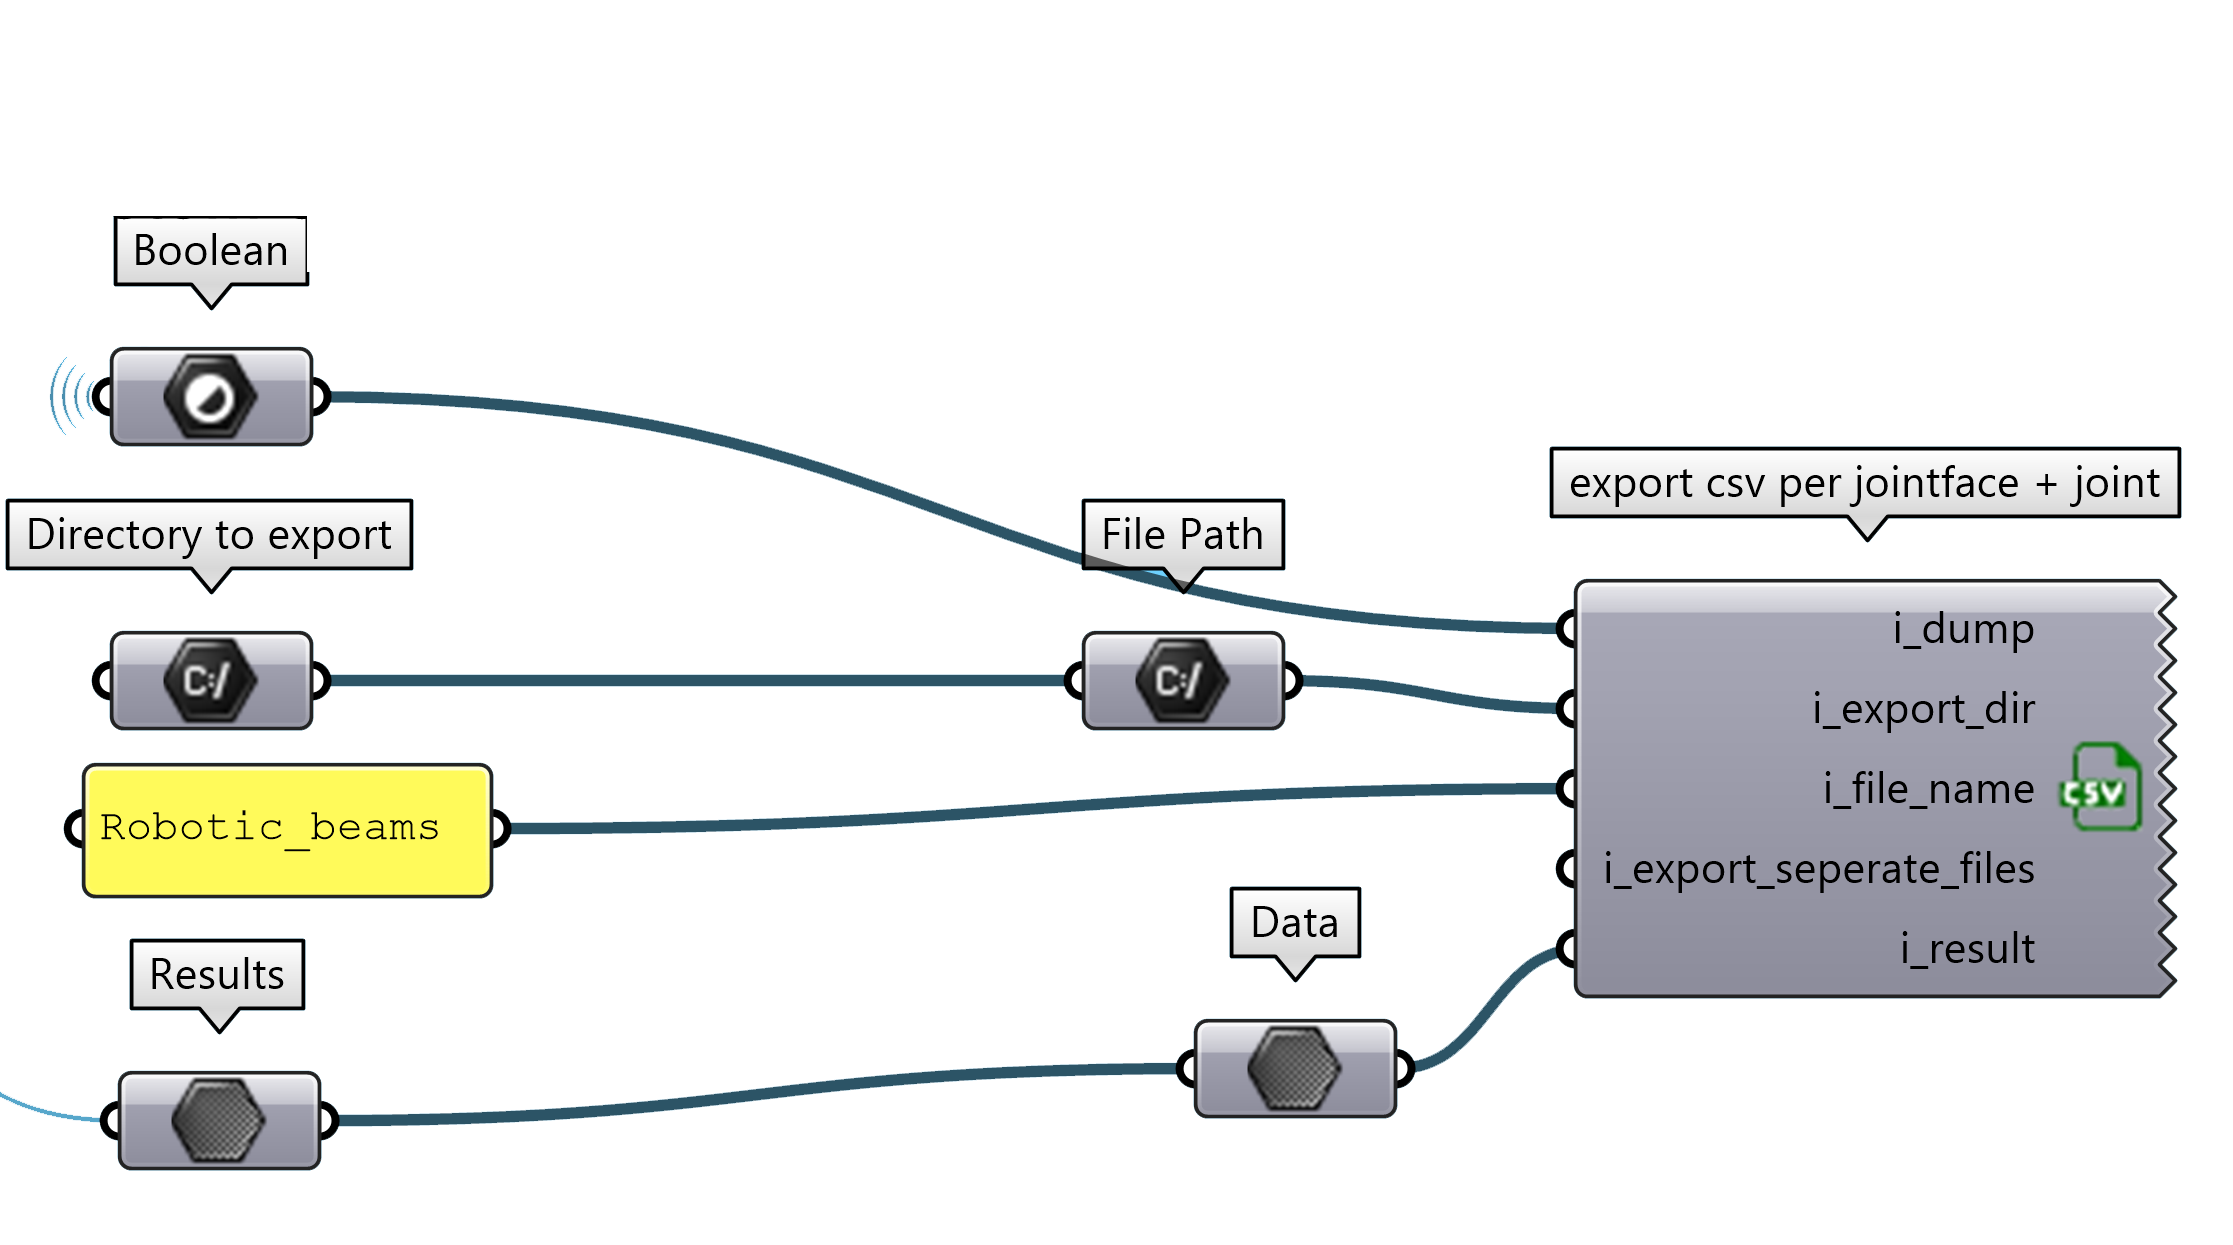
The CSV contains the values per element..
Beam ID |
Min Deviation |
Max Deviation |
Std Deviation |
RMSE |
Mean |
|---|---|---|---|---|---|
0 |
0 |
0.024 |
0.0029 |
0.0045 |
0.0034 |
1 |
0 |
0.0239 |
0.0034 |
0.0057 |
0.0046 |
2 |
0 |
0.0316 |
0.0036 |
0.0056 |
0.0042 |
3 |
0 |
0.024 |
0.0069 |
0.0088 |
0.0055 |
4 |
0 |
0.0117 |
0.0029 |
0.0053 |
0.0045 |
5 |
0 |
0.0242 |
0.0045 |
0.0067 |
0.0049 |
… |
… |
… |
… |
… |
… |
DF’s components:
